SNAP Library 6.0, Developer Reference  2020-12-09 16:24:20
SNAP, a general purpose, high performance system for analysis and manipulation of large networks
kronecker.cpp File Reference
#include "stdafx.h"
#include "kronecker.h"
Include dependency graph for kronecker.cpp:

Go to the source code of this file.

Functions

void GetMinMax (const TFltPrV &XYValV, double &Min, double &Max, const bool &ResetMinMax)
 
void PlotGrad (const TFltPrV &EstLLV, const TFltPrV &TrueLLV, const TVec< TFltPrV > &GradVV, const TFltPrV &AcceptV, const TStr &OutFNm, const TStr &Desc)
 
void PlotAutoCorrelation (const TFltV &ValV, const int &MaxK, const TStr &OutFNm, const TStr &Desc)
 
void McMcGetAvgAvg (const TFltV &AvgJV, double &AvgAvg)
 
void McMcGetAvgJ (const TVec< TFltV > &ChainLLV, TFltV &AvgJV)
 
void PlotTrueAndEst (const TStr &OutFNm, const TStr &Desc, const TStr &YLabel, const TFltPrV &EstV, const TFltPrV &TrueV)
 

Function Documentation

void GetMinMax ( const TFltPrV XYValV,
double &  Min,
double &  Max,
const bool &  ResetMinMax 
)

Definition at line 1732 of file kronecker.cpp.

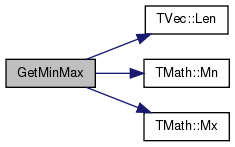
References TVec< TVal, TSizeTy >::Len(), TMath::Mn(), TFlt::Mn, TMath::Mx(), and TFlt::Mx.

Referenced by PlotGrad().
1732  {
1733  if (ResetMinMax) { Min = TFlt::Mx; Max = TFlt::Mn; }
1734  for (int i = 0; i < XYValV.Len(); i++) {
1735  Min = TMath::Mn(Min, XYValV[i].Val2.Val);
1736  Max = TMath::Mx(Max, XYValV[i].Val2.Val);
1737  }
1738 }
static const T & Mn(const T &LVal, const T &RVal)
Definition: xmath.h:36
static const T & Mx(const T &LVal, const T &RVal)
Definition: xmath.h:32
TSizeTy Len() const
Returns the number of elements in the vector.
Definition: ds.h:575
static const double Mx
Definition: dt.h:1391
static const double Mn
Definition: dt.h:1390

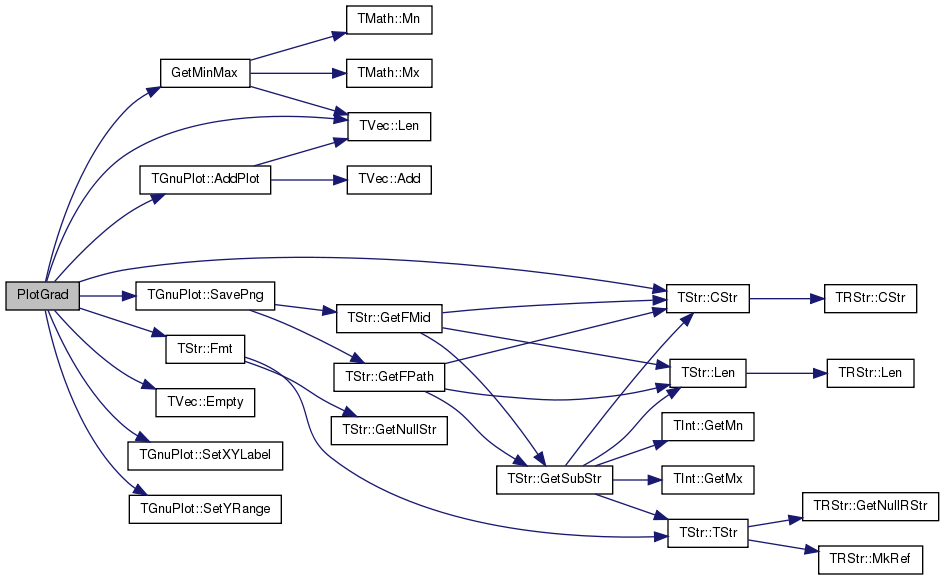
Here is the call graph for this function:

Here is the caller graph for this function:

void McMcGetAvgAvg ( const TFltV AvgJV,
double &  AvgAvg 
)

Definition at line 1876 of file kronecker.cpp.

References TVec< TVal, TSizeTy >::Len().

Referenced by TKroneckerLL::CalcChainR2().

1876  {
1877  AvgAvg = 0.0;
1878  for (int j = 0; j < AvgJV.Len(); j++) {
1879  AvgAvg += AvgJV[j]; }
1880  AvgAvg /= AvgJV.Len();
1881 }
TSizeTy Len() const
Returns the number of elements in the vector.
Definition: ds.h:575

Here is the call graph for this function:

Here is the caller graph for this function:

void McMcGetAvgJ ( const TVec< TFltV > &  ChainLLV,
TFltV AvgJV 
)

Definition at line 1883 of file kronecker.cpp.

References TVec< TVal, TSizeTy >::Add(), and TVec< TVal, TSizeTy >::Len().

Referenced by TKroneckerLL::CalcChainR2().

1883  {
1884  for (int j = 0; j < ChainLLV.Len(); j++) {
1885  const TFltV& ChainV = ChainLLV[j];
1886  double Avg = 0;
1887  for (int i = 0; i < ChainV.Len(); i++) {
1888  Avg += ChainV[i];
1889  }
1890  AvgJV.Add(Avg/ChainV.Len());
1891  }
1892 }
TSizeTy Len() const
Returns the number of elements in the vector.
Definition: ds.h:575
TSizeTy Add()
Adds a new element at the end of the vector, after its current last element.
Definition: ds.h:602

Here is the call graph for this function:

Here is the caller graph for this function:

void PlotAutoCorrelation ( const TFltV ValV,
const int &  MaxK,
const TStr OutFNm,
const TStr Desc 
)

Definition at line 1773 of file kronecker.cpp.

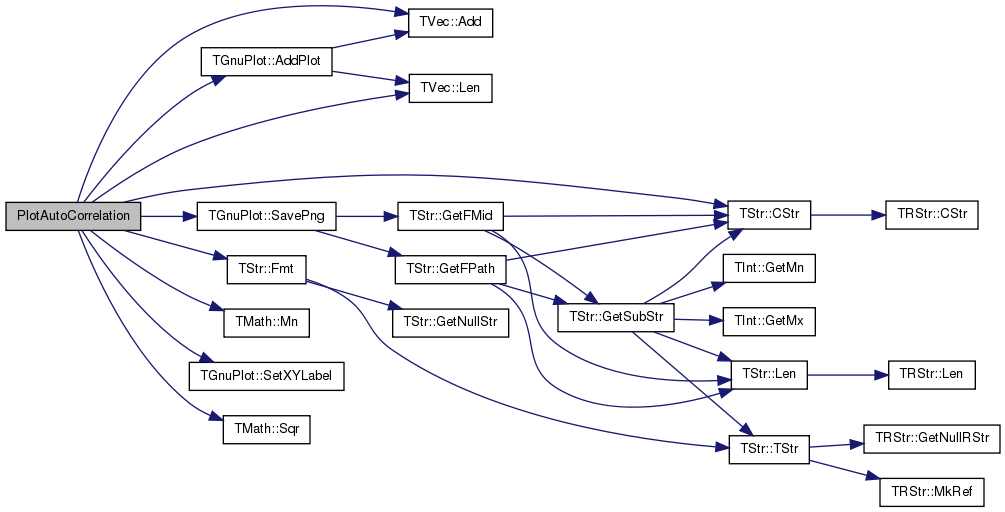
References TVec< TVal, TSizeTy >::Add(), TGnuPlot::AddPlot(), TStr::CStr(), TStr::Fmt(), gpwLines, TVec< TVal, TSizeTy >::Len(), TMath::Mn(), TGnuPlot::SavePng(), TGnuPlot::SetXYLabel(), and TMath::Sqr().

Referenced by TKroneckerLL::TestSamplePerm().
1773  {
1774  double Avg=0.0, Var=0.0;
1775  for (int i = 0; i < ValV.Len(); i++) { Avg += ValV[i]; }
1776  Avg /= (double) ValV.Len();
1777  for (int i = 0; i < ValV.Len(); i++) { Var += TMath::Sqr(ValV[i]-Avg); }
1778  TFltPrV ACorrV;
1779  for (int k = 0; k < TMath::Mn(ValV.Len(), MaxK); k++) {
1780  double corr = 0.0;
1781  for (int i = 0; i < ValV.Len() - k; i++) {
1782  corr += (ValV[i]-Avg)*(ValV[i+k]-Avg);
1783  }
1784  ACorrV.Add(TFltPr(k, corr/Var));
1785  }
1786  // plot grads
1787  TGnuPlot GP("sAutoCorr-"+OutFNm, TStr::Fmt("AutoCorrelation (%d samples). %s", ValV.Len(), Desc.CStr()), true);
1788  GP.AddPlot(ACorrV, gpwLines, "", "linewidth 1");
1789  GP.SetXYLabel("Lag, k", "Autocorrelation, r_k");
1790  GP.SavePng();
1791 }
static const T & Mn(const T &LVal, const T &RVal)
Definition: xmath.h:36
TSizeTy Len() const
Returns the number of elements in the vector.
Definition: ds.h:575
static double Sqr(const double &x)
Definition: xmath.h:12
TPair< TFlt, TFlt > TFltPr
Definition: ds.h:99
static TStr Fmt(const char *FmtStr,...)
Definition: dt.cpp:1599
char * CStr()
Definition: dt.h:479
TSizeTy Add()
Adds a new element at the end of the vector, after its current last element.
Definition: ds.h:602
Vector is a sequence TVal objects representing an array that can change in size.
Definition: ds.h:430

Here is the call graph for this function:

Here is the caller graph for this function:

void PlotGrad ( const TFltPrV EstLLV,
const TFltPrV TrueLLV,
const TVec< TFltPrV > &  GradVV,
const TFltPrV AcceptV,
const TStr OutFNm,
const TStr Desc 
)

Definition at line 1740 of file kronecker.cpp.

References TGnuPlot::AddPlot(), TStr::CStr(), TVec< TVal, TSizeTy >::Empty(), TStr::Fmt(), GetMinMax(), gpwLines, TVec< TVal, TSizeTy >::Len(), TGnuPlot::SavePng(), TGnuPlot::SetXYLabel(), and TGnuPlot::SetYRange().

Referenced by TKroneckerLL::TestSamplePerm().

1740  {
1741  double Min, Max, Min1, Max1;
1742  // plot log-likelihood
1743  { TGnuPlot GP("sLL-"+OutFNm, TStr::Fmt("Log-likelihood (avg 1k samples). %s", Desc.CStr()), true);
1744  GP.AddPlot(EstLLV, gpwLines, "Esimated LL", "linewidth 1");
1745  if (! TrueLLV.Empty()) { GP.AddPlot(TrueLLV, gpwLines, "TRUE LL", "linewidth 1"); }
1746  //GetMinMax(EstLLV, Min, Max, true); GetMinMax(TrueLLV, Min, Max, false);
1747  //GP.SetYRange((int)floor(Min-1), (int)ceil(Max+1));
1748  GP.SetXYLabel("Sample Index (time)", "Log-likelihood");
1749  GP.SavePng(); }
1750  // plot accept
1751  { TGnuPlot GP("sAcc-"+OutFNm, TStr::Fmt("Pct. accepted rnd moves (over 1k samples). %s", Desc.CStr()), true);
1752  GP.AddPlot(AcceptV, gpwLines, "Pct accepted swaps", "linewidth 1");
1753  GP.SetXYLabel("Sample Index (time)", "Pct accept permutation swaps");
1754  GP.SavePng(); }
1755  // plot grads
1756  TGnuPlot GPAll("sGradAll-"+OutFNm, TStr::Fmt("Gradient (avg 1k samples). %s", Desc.CStr()), true);
1757  GetMinMax(GradVV[0], Min1, Max1, true);
1758  for (int g = 0; g < GradVV.Len(); g++) {
1759  GPAll.AddPlot(GradVV[g], gpwLines, TStr::Fmt("param %d", g+1), "linewidth 1");
1760  GetMinMax(GradVV[g], Min1, Max1, false);
1761  TGnuPlot GP(TStr::Fmt("sGrad%02d-", g+1)+OutFNm, TStr::Fmt("Gradient (avg 1k samples). %s", Desc.CStr()), true);
1762  GP.AddPlot(GradVV[g], gpwLines, TStr::Fmt("param id %d", g+1), "linewidth 1");
1763  GetMinMax(GradVV[g], Min, Max, true);
1764  GP.SetYRange((int)floor(Min-1), (int)ceil(Max+1));
1765  GP.SetXYLabel("Sample Index (time)", "Gradient");
1766  GP.SavePng();
1767  }
1768  GPAll.SetYRange((int)floor(Min1-1), (int)ceil(Max1+1));
1769  GPAll.SetXYLabel("Sample Index (time)", "Gradient");
1770  GPAll.SavePng();
1771 }
TSizeTy Len() const
Returns the number of elements in the vector.
Definition: ds.h:575
void GetMinMax(const TFltPrV &XYValV, double &Min, double &Max, const bool &ResetMinMax)
Definition: kronecker.cpp:1732
bool Empty() const
Tests whether the vector is empty.
Definition: ds.h:570
static TStr Fmt(const char *FmtStr,...)
Definition: dt.cpp:1599
char * CStr()
Definition: dt.h:479

Here is the call graph for this function:

Here is the caller graph for this function:

void PlotTrueAndEst ( const TStr OutFNm,
const TStr Desc,
const TStr YLabel,
const TFltPrV EstV,
const TFltPrV TrueV 
)

Definition at line 2009 of file kronecker.cpp.

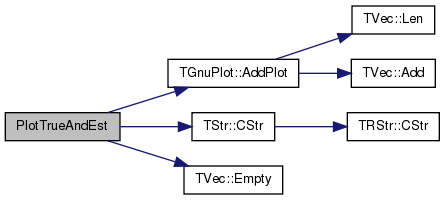
References TGnuPlot::AddPlot(), TStr::CStr(), TVec< TVal, TSizeTy >::Empty(), gpwLines, and gpwLinesPoints.

Referenced by TKroneckerLL::GradDescentConvergence().
2009  {
2010  TGnuPlot GP(OutFNm, Desc.CStr(), true);
2011  GP.AddPlot(EstV, gpwLinesPoints, YLabel, "linewidth 1 pointtype 6 pointsize 1");
2012  if (! TrueV.Empty()) { GP.AddPlot(TrueV, gpwLines, "TRUE"); }
2013  GP.SetXYLabel("Gradient descent iterations", YLabel);
2014  GP.SavePng();
2015 }
bool Empty() const
Tests whether the vector is empty.
Definition: ds.h:570
int AddPlot(const TIntV &YValV, const TGpSeriesTy &SeriesTy=gpwLinesPoints, const TStr &Label=TStr(), const TStr &Style=TStr())
Definition: gnuplot.cpp:186
char * CStr()
Definition: dt.h:479

Here is the call graph for this function:

Here is the caller graph for this function: