|
SNAP Library , Developer Reference
2013-01-07 14:03:36
SNAP, a general purpose, high performance system for analysis and manipulation of large networks
|
|
SNAP Library , Developer Reference
2013-01-07 14:03:36
SNAP, a general purpose, high performance system for analysis and manipulation of large networks
|
#include <gnuplot.h>
Classes | |
| class | TGpSeries |
| class | TGpSeriesCmp |
Public Member Functions | |
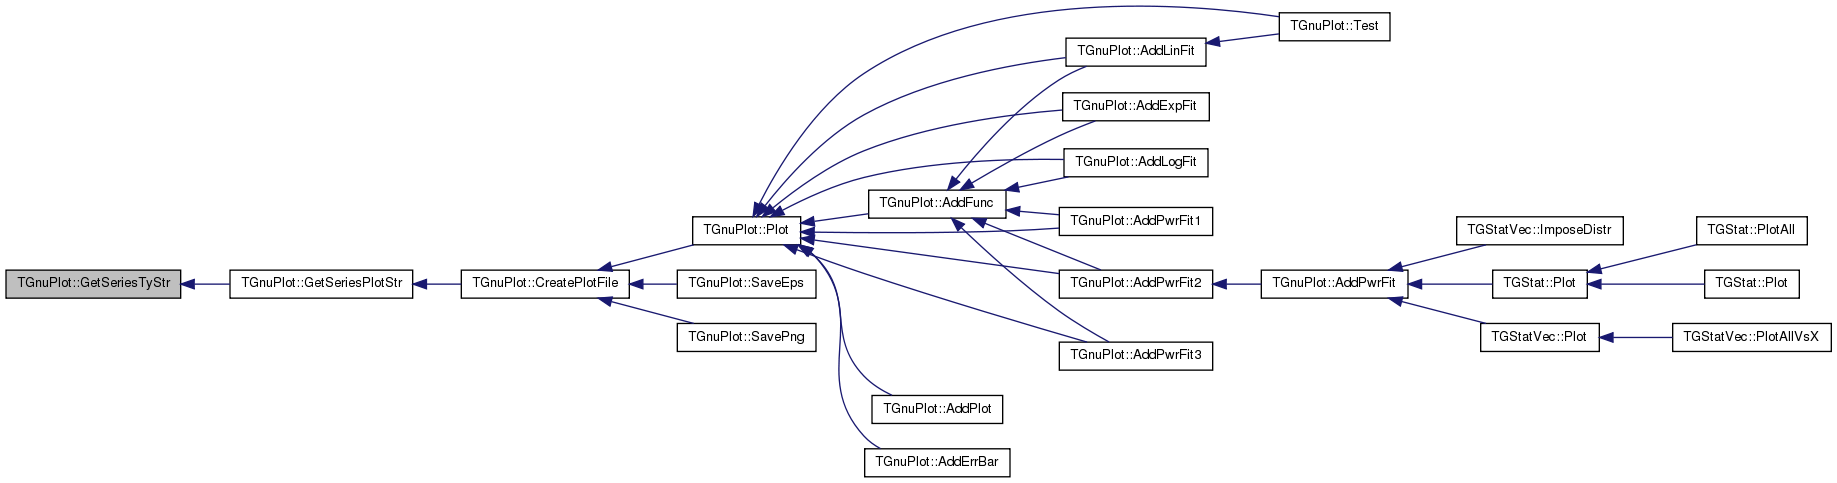
| TStr | GetSeriesPlotStr (const int &PlotN) |
| int | IsSameXCol (const int &CurId, const int &PrevId) const |
| void | CreatePlotFile (const TStr &Comment=TStr()) |
| void | RunGnuPlot () const |
| TGnuPlot (const TStr &FileNm="gplot", const TStr &PlotTitle=TStr(), const bool &Grid=true) | |
| TGnuPlot (const TStr &DataFileNm, const TStr &PlotFileNm, const TStr &PlotTitle, const bool &Grid) | |
| TGnuPlot (const TGnuPlot &GnuPlot) | |
| TGnuPlot & | operator= (const TGnuPlot &GnuPlot) |
| void | SetTitle (const TStr &PlotTitle) |
| void | SetXLabel (const TStr &XLabel) |
| void | SetYLabel (const TStr &YLabel) |
| void | SetXYLabel (const TStr &XLabel, const TStr &YLabel) |
| void | SetDataPlotFNm (const TStr &DatFNm, const TStr &PltFNm) |
| void | ShowGrid (const bool &Show) |
| void | Pause (const bool &DoPause) |
| void | SetScale (const TGpScaleTy &GpScaleTy) |
| void | SetXRange (const double &Min, const double &Max) |
| void | SetYRange (const double &Min, const double &Max) |
| void | AddCmd (const TStr &Cmd) |
| TStr | GetLineStyle (const int &PlotId) const |
| void | SetLineStyle (const int &PlotId, const TStr &StyleStr) |
| int | AddFunc (const TStr &FuncStr, const TGpSeriesTy &SeriesTy=gpwLinesPoints, const TStr &Label=TStr(), const TStr &Style=TStr()) |
| int | AddPlot (const TIntV &YValV, const TGpSeriesTy &SeriesTy=gpwLinesPoints, const TStr &Label=TStr(), const TStr &Style=TStr()) |
| int | AddPlot (const TFltV &YValV, const TGpSeriesTy &SeriesTy=gpwLinesPoints, const TStr &Label=TStr(), const TStr &Style=TStr()) |
| int | AddPlot (const TFltV &XValV, const TFltV &YValV, const TGpSeriesTy &SeriesTy=gpwLinesPoints, const TStr &Label=TStr(), const TStr &Style=TStr()) |
| int | AddPlot (const TIntPrV &XYValV, const TGpSeriesTy &SeriesTy=gpwLinesPoints, const TStr &Label=TStr(), const TStr &Style=TStr()) |
| int | AddPlot (const TFltPrV &XYValV, const TGpSeriesTy &SeriesTy=gpwLinesPoints, const TStr &Label=TStr(), const TStr &Style=TStr()) |
| int | AddPlot (const TIntKdV &XYValV, const TGpSeriesTy &SeriesTy=gpwLinesPoints, const TStr &Label=TStr(), const TStr &Style=TStr()) |
| int | AddPlot (const TFltKdV &XYValV, const TGpSeriesTy &SeriesTy=gpwLinesPoints, const TStr &Label=TStr(), const TStr &Style=TStr()) |
| int | AddPlot (const TIntFltKdV &XYValV, const TGpSeriesTy &SeriesTy=gpwLinesPoints, const TStr &Label=TStr(), const TStr &Style=TStr()) |
| int | AddPlot (const TIntFltPrV &XYValV, const TGpSeriesTy &SeriesTy=gpwLinesPoints, const TStr &Label=TStr(), const TStr &Style=TStr()) |
| int | AddPlot (const TStr &DataFNm, const int &ColY, const TGpSeriesTy &SeriesTy=gpwLinesPoints, const TStr &Label=TStr(), const TStr &Style=TStr()) |
| int | AddPlot (const TStr &DataFNm, const int &ColX, const int &ColY, const TGpSeriesTy &SeriesTy=gpwLinesPoints, const TStr &Label=TStr(), const TStr &Style=TStr()) |
| template<class TKey , class TDat , class THashFunc > | |
| int | AddPlot (const THash< TKey, TDat, THashFunc > &XYValH, const TGpSeriesTy &SeriesTy=gpwLinesPoints, const TStr &Label=TStr(), const TStr &Style=TStr(), const bool &ExpBucket=false) |
| template<class TKey , class THashFunc > | |
| int | AddPlot (const THash< TKey, TMom, THashFunc > &ValMomH, const TGpSeriesTy &SeriesTy=gpwLinesPoints, const TStr &Label=TStr(), const TStr &Style=TStr(), bool PlotAvg=true, bool PlotMed=true, bool PlotMin=false, bool PlotMax=false, bool PlotSDev=false, bool PlotStdErr=false, const bool &ExpBucket=false) |
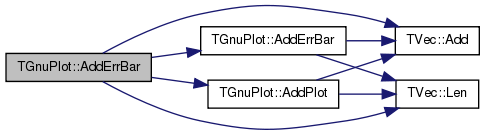
| int | AddErrBar (const TFltTrV &XYDValV, const TStr &Label=TStr()) |
| int | AddErrBar (const TFltTrV &XYDValV, const TStr &DatLabel, const TStr &ErrLabel) |
| int | AddErrBar (const TFltV &YValV, const TFltV &DeltaYV, const TStr &Label=TStr()) |
| int | AddErrBar (const TFltV &XValV, const TFltV &YValV, const TFltV &DeltaYV, const TStr &Label=TStr()) |
| int | AddErrBar (const TFltPrV &XYValV, const TFltV &DeltaYV, const TStr &Label=TStr()) |
| int | AddErrBar (const TFltKdV &XYValV, const TFltV &DeltaYV, const TStr &Label=TStr()) |
| int | AddErrBar (const TFltPrV &XYValV, const TFltV &DeltaYV, const TStr &DatLabel, const TStr &ErrLabel) |
| int | AddLinFit (const int &PlotId, const TGpSeriesTy &SeriesTy=gpwLines, const TStr &Style=TStr()) |
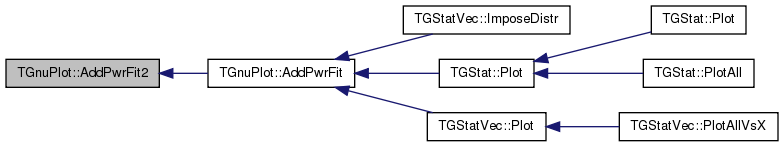
| int | AddPwrFit (const int &PlotId, const TGpSeriesTy &SeriesTy=gpwLines, const TStr &Style=TStr()) |
| int | AddPwrFit1 (const int &PlotId, const TGpSeriesTy &SeriesTy=gpwLines, const TStr &Style=TStr()) |
| int | AddPwrFit2 (const int &PlotId, const TGpSeriesTy &SeriesTy=gpwLines, const double &MinX=-1.0, const TStr &Style=TStr()) |
| int | AddPwrFit3 (const int &PlotId, const TGpSeriesTy &SeriesTy=gpwLines, const double &MinX=-1.0, const TStr &Style=TStr()) |
| int | AddPwrFit3 (const int &PlotId, const TGpSeriesTy &SeriesTy, const double &MinX, const TStr &Style, double &Intercept, double &Slope, double &R2) |
| int | AddLogFit (const int &PlotId, const TGpSeriesTy &SeriesTy=gpwLines, const TStr &Style=TStr()) |
| int | AddExpFit (const int &PlotId, const TGpSeriesTy &SeriesTy=gpwLines, const double &FitXOffset=0.0, const TStr &Style=TStr()) |
| void | SavePng (const int &SizeX=1000, const int &SizeY=800, const TStr &Comment=TStr()) |
| void | SavePng (const TStr &FNm, const int &SizeX=1000, const int &SizeY=800, const TStr &Comment=TStr(), const TStr &Terminal=TStr()) |
| void | SaveEps (const int &FontSz=30, const TStr &Comment=TStr()) |
| void | SaveEps (const TStr &FNm, const int &FontSz=30, const TStr &Comment=TStr()) |
| void | Plot (const TStr &Comment=TStr()) |
Static Public Member Functions | |
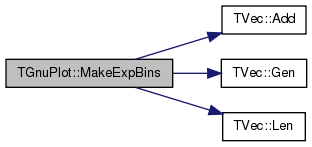
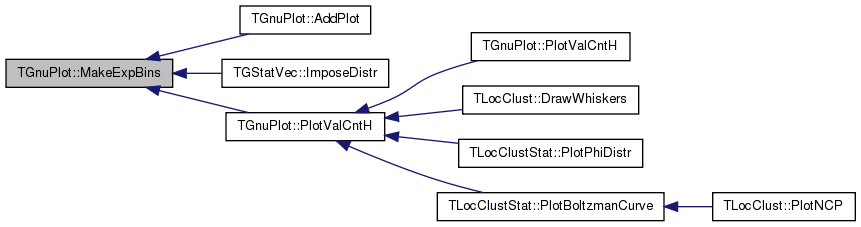
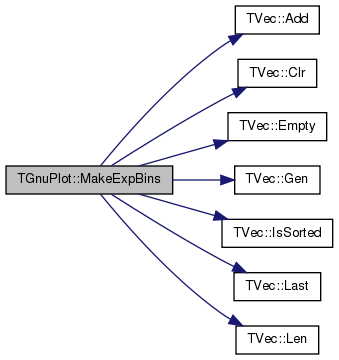
| static void | MakeExpBins (const TFltPrV &XYValV, TFltPrV &ExpXYValV, const double &BinFactor=2, const double &MinYVal=1) |
| static void | MakeExpBins (const TFltKdV &XYValV, TFltKdV &ExpXYValV, const double &BinFactor=2, const double &MinYVal=1) |
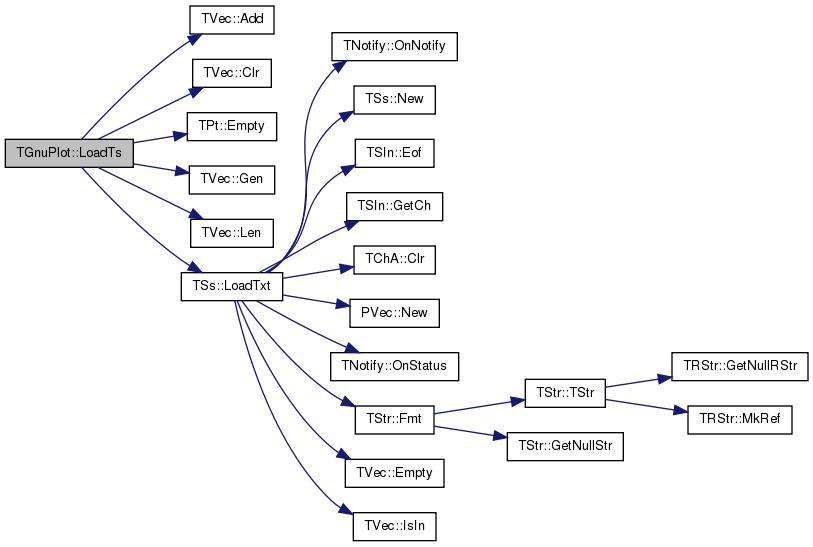
| static void | LoadTs (const TStr &FNm, TStrV &ColNmV, TVec< TFltKdV > &ColV) |
| static TStr | GetScaleStr (const TGpScaleTy &ScaleTy) |
| static TStr | GetSeriesTyStr (const TGpSeriesTy &SeriesTy) |
| static void | SaveTs (const TIntKdV &KdV, const TStr &FNm, const TStr &HeadLn=TStr()) |
| static void | SaveTs (const TIntFltKdV &KdV, const TStr &FNm, const TStr &HeadLn=TStr()) |
| template<class TVal1 , class TVal2 > | |
| static void | SaveTs (const TVec< TPair< TVal1, TVal2 > > &ValV, const TStr &FNm, const TStr &HeadLn=TStr()) |
| template<class TVal1 , class TVal2 , class TVal3 > | |
| static void | SaveTs (const TVec< TTriple< TVal1, TVal2, TVal3 > > &ValV, const TStr &FNm, const TStr &HeadLn=TStr()) |
| template<class TVal , int Vals> | |
| static void | SaveTs (const TVec< TTuple< TVal, Vals > > &ValV, const TStr &FNm, const TStr &HeadLn=TStr()) |
| static void | Test () |
| template<class TVal1 , class TVal2 > | |
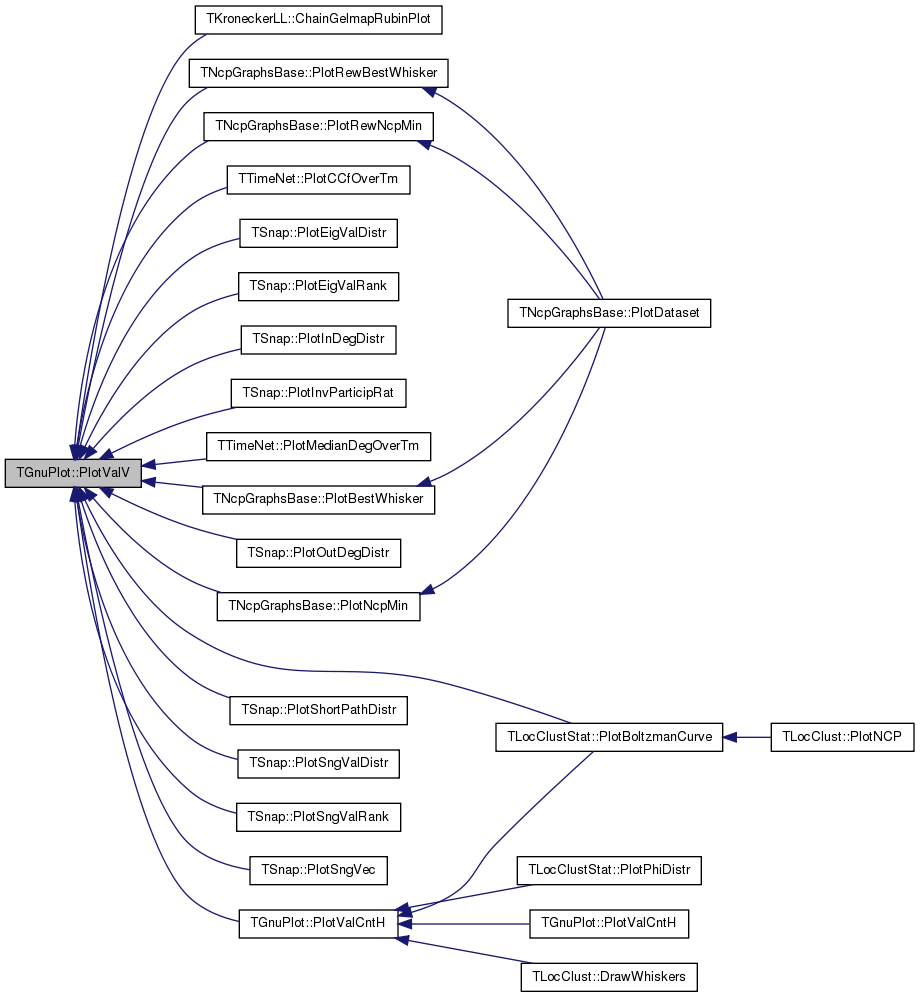
| static void | PlotValV (const TVec< TPair< TVal1, TVal2 > > &ValV, const TStr &OutFNmPref, const TStr &Desc="", const TStr &XLabel="", const TStr &YLabel="", const TGpScaleTy &ScaleTy=gpsAuto, const bool &PowerFit=false, const TGpSeriesTy &SeriesTy=gpwLinesPoints) |
| template<class TVal1 , class TVal2 > | |
| static void | PlotValV (const TVec< TPair< TVal1, TVal2 > > &ValV1, const TStr &Name1, const TVec< TPair< TVal1, TVal2 > > &ValV2, const TStr &Name2, const TStr &OutFNmPref, const TStr &Desc="", const TStr &XLabel="", const TStr &YLabel="", const TGpScaleTy &ScaleTy=gpsAuto, const bool &PowerFit=false, const TGpSeriesTy &SeriesTy=gpwLinesPoints) |
| template<class TVal1 > | |
| static void | PlotValV (const TVec< TVal1 > &ValV, const TStr &OutFNmPref, const TStr &Desc="", const TStr &XLabel="", const TStr &YLabel="", const TGpScaleTy &ScaleTy=gpsAuto, const bool &PowerFit=false, const TGpSeriesTy &SeriesTy=gpwLinesPoints) |
| template<class TKey , class TVal , class THashFunc > | |
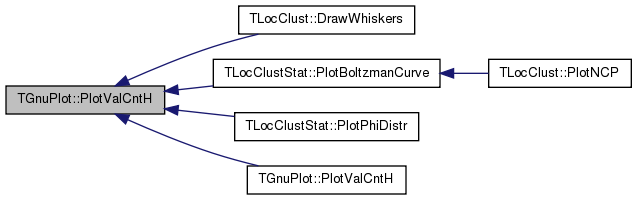
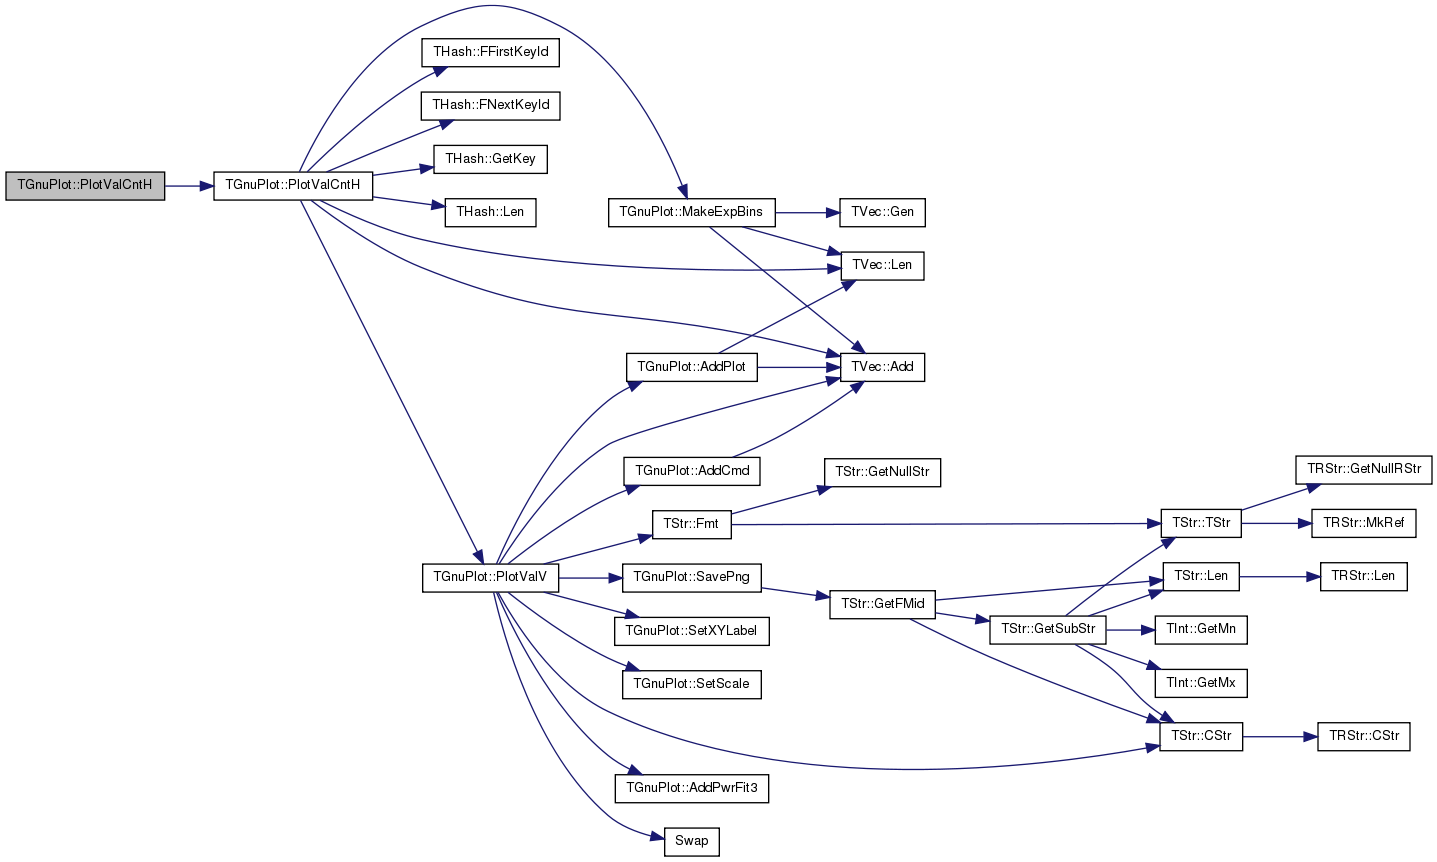
| static void | PlotValCntH (const THash< TKey, TVal, THashFunc > &ValCntH, const TStr &OutFNmPref, const TStr &Desc="", const TStr &XLabel="", const TStr &YLabel="", const TGpScaleTy &ScaleTy=gpsAuto, const bool &PowerFit=false, const TGpSeriesTy &SeriesTy=gpwLinesPoints, const bool &PlotNCDF=false, const bool &ExpBucket=false) |
| template<class TKey , class TVal , class THashFunc > | |
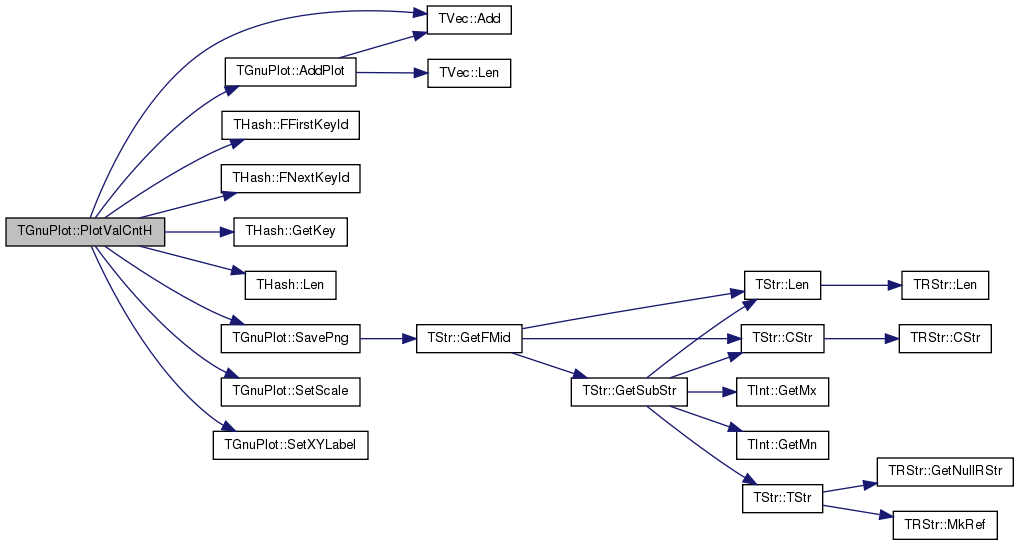
| static void | PlotValCntH (const THash< TKey, TVal, THashFunc > &ValCntH1, const TStr &Label1, const THash< TKey, TVal, THashFunc > &ValCntH2, const TStr &Label2, const TStr &OutFNmPref, const TStr &Desc, const TStr &XLabel, const TStr &YLabel, const TGpScaleTy &ScaleTy=gpsAuto, const TGpSeriesTy &SeriesTy=gpwLinesPoints) |
| template<class TKey , class TVal , class THashFunc > | |
| static void | PlotValCntH (const THash< TKey, TVal, THashFunc > &ValCntH1, const TStr &Label1, const THash< TKey, TVal, THashFunc > &ValCntH2, const TStr &Label2, const THash< TKey, TVal, THashFunc > &ValCntH3, const TStr &Label3, const TStr &OutFNmPref, const TStr &Desc, const TStr &XLabel, const TStr &YLabel, const TGpScaleTy &ScaleTy=gpsAuto, const TGpSeriesTy &SeriesTy=gpwLinesPoints) |
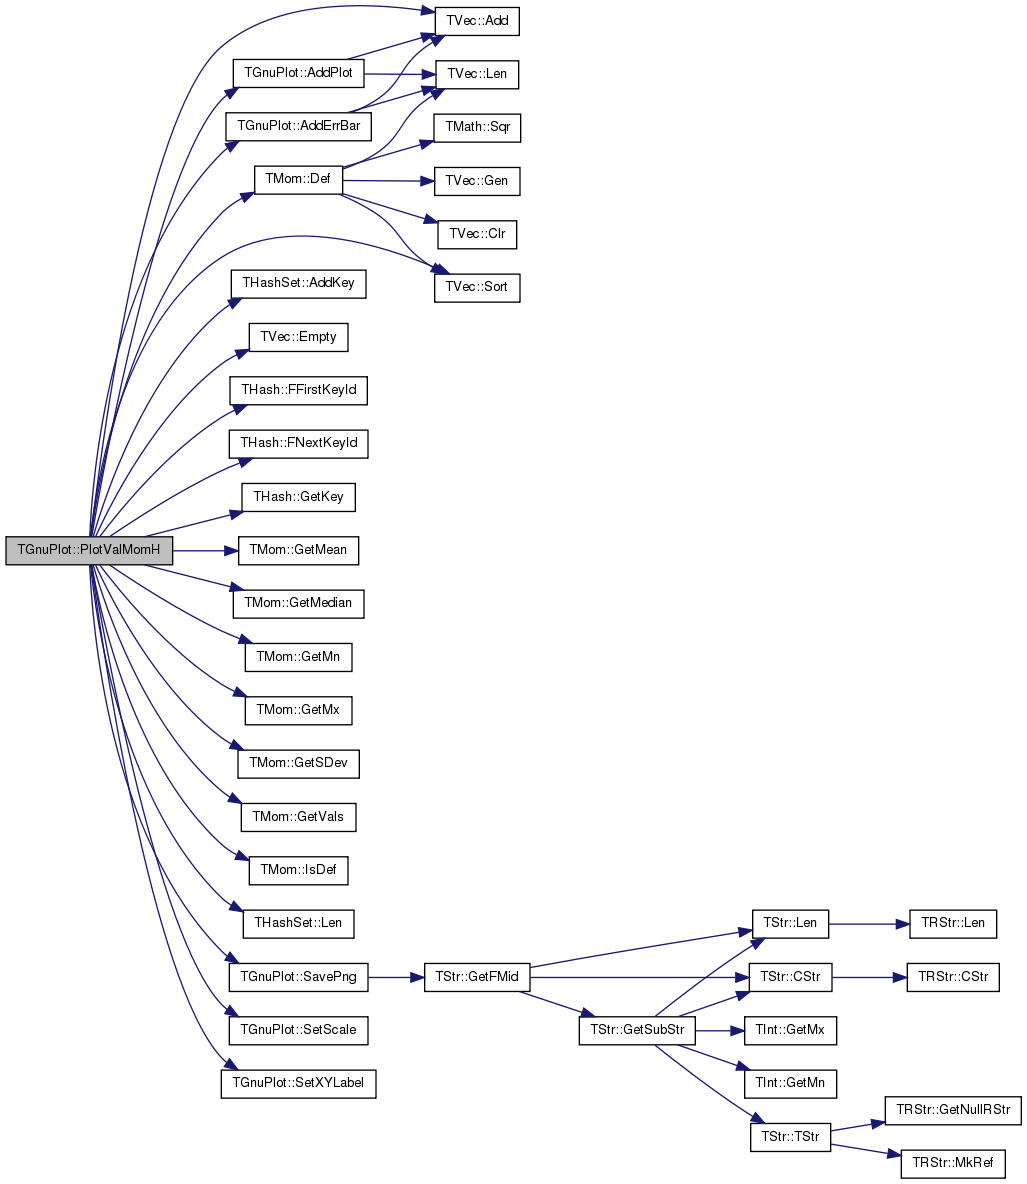
| template<class TVal1 > | |
| static void | PlotValMomH (const THash< TVal1, TMom > &ValMomH, const TStr &OutFNmPref, const TStr &Desc="", const TStr &XLabel="", const TStr &YLabel="", const TGpScaleTy &ScaleTy=gpsAuto, const TGpSeriesTy &SeriesTy=gpwLinesPoints, bool PlotAvg=true, bool PlotMed=true, bool PlotMin=false, bool PlotMax=false, bool PlotSDev=false, bool PlotStdErr=true, bool PlotScatter=false) |
Static Public Attributes | |
| static TStr | DefPlotFNm = "GnuPlot.plt" |
| static TStr | DefDataFNm = "GnuPlot.tab" |
Static Private Member Functions | |
| static int | GetTics42 () |
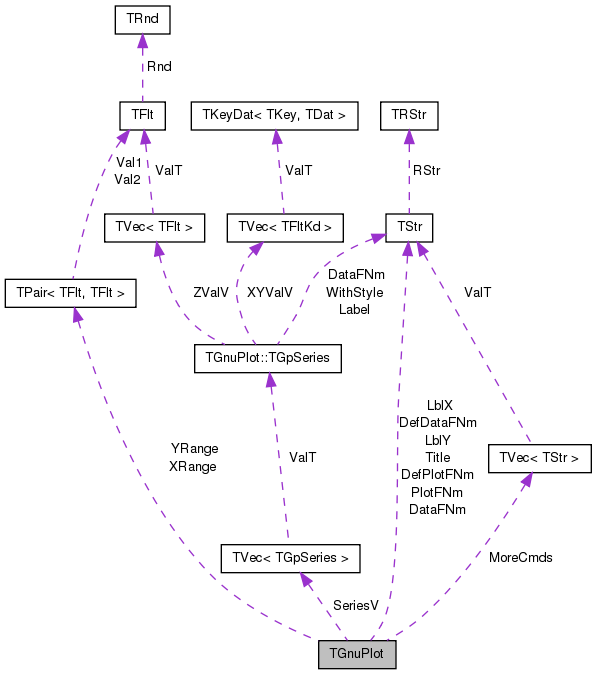
Private Attributes | |
| TStr | DataFNm |
| TStr | PlotFNm |
| TStr | Title |
| TStr | LblX |
| TStr | LblY |
| TGpScaleTy | ScaleTy |
| TFltPr | YRange |
| TFltPr | XRange |
| bool | SetGrid |
| bool | SetPause |
| TVec< TGpSeries > | SeriesV |
| TStrV | MoreCmds |
Static Private Attributes | |
| static int | Tics42 = TGnuPlot::GetTics42() |
| TGnuPlot::TGnuPlot | ( | const TStr & | FileNm = "gplot", |
| const TStr & | PlotTitle = TStr(), |
||
| const bool & | Grid = true |
||
| ) |
Definition at line 84 of file gnuplot.cpp.
References TStr::Empty(), and IAssert.
                                                                              :
 DataFNm(FileNm+".tab"), PlotFNm(FileNm+".plt"), Title(PlotTitle), LblX(), LblY(), ScaleTy(gpsAuto),
 YRange(0, 0), XRange(0, 0), SetGrid(Grid), SetPause(true),
 SeriesV(), MoreCmds() {
  IAssert(! FileNm.Empty());
}

| TGnuPlot::TGnuPlot | ( | const TStr & | DataFileNm, |
| const TStr & | PlotFileNm, | ||
| const TStr & | PlotTitle, | ||
| const bool & | Grid | ||
| ) |
| TGnuPlot::TGnuPlot | ( | const TGnuPlot & | GnuPlot | ) |
Definition at line 98 of file gnuplot.cpp.
                                          : DataFNm(GnuPlot.DataFNm), PlotFNm(GnuPlot.PlotFNm),
  Title(GnuPlot.Title), LblX(GnuPlot.LblX), LblY(GnuPlot.LblY), ScaleTy(GnuPlot.ScaleTy), YRange(GnuPlot.YRange),
  XRange(GnuPlot.XRange), SetGrid(GnuPlot.SetGrid), SetPause(GnuPlot.SetPause), SeriesV(GnuPlot.SeriesV),
  MoreCmds(GnuPlot.MoreCmds) {
}
| void TGnuPlot::AddCmd | ( | const TStr & | Cmd | ) | [inline] |
Definition at line 75 of file gnuplot.h.
References TVec< TVal >::Add(), and MoreCmds.
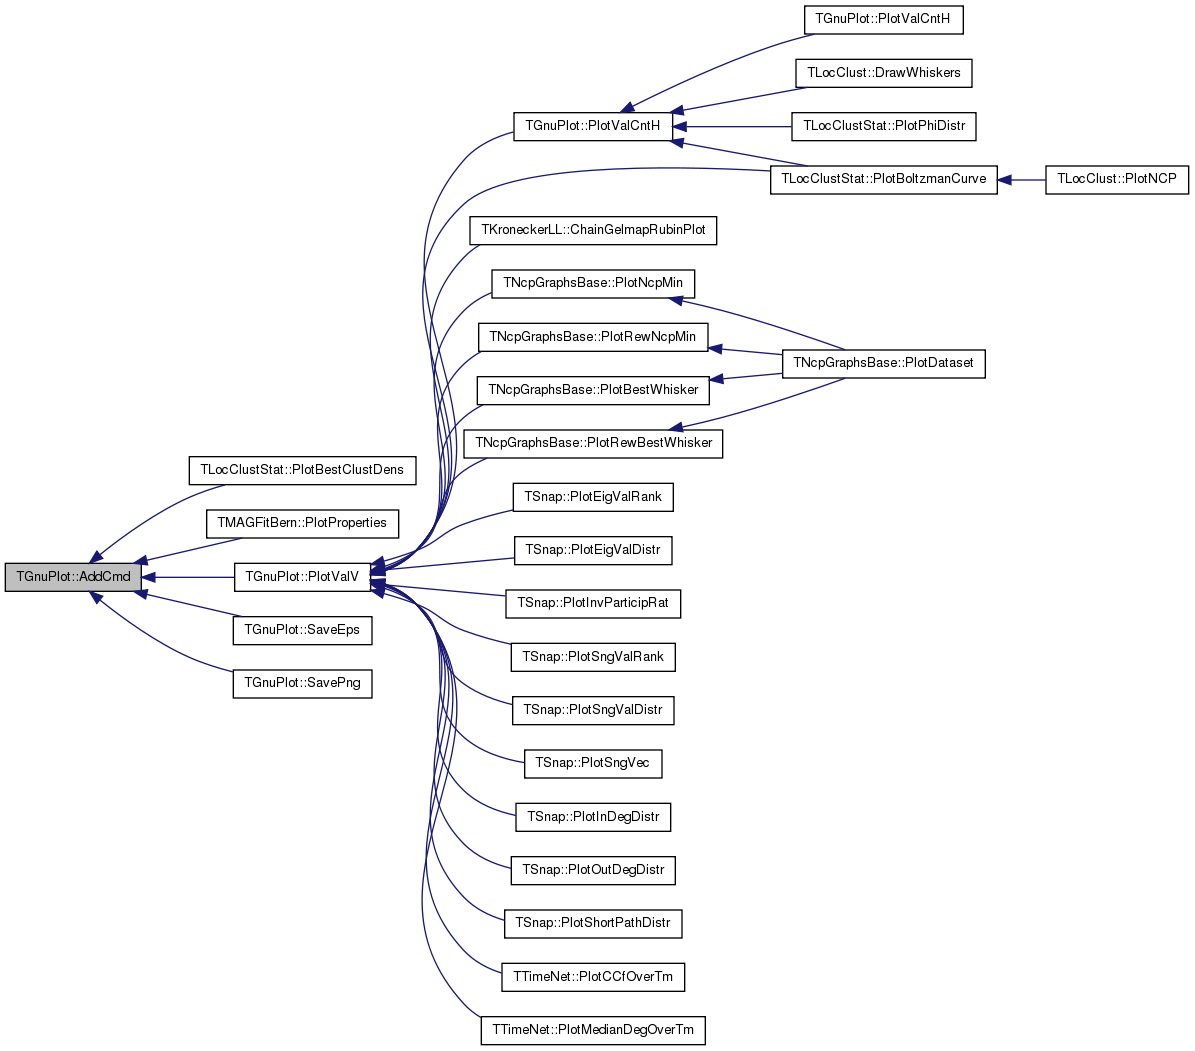
Referenced by TLocClustStat::PlotBestClustDens(), TMAGFitBern::PlotProperties(), PlotValV(), SaveEps(), and SavePng().

| int TGnuPlot::AddErrBar | ( | const TFltTrV & | XYDValV, |
| const TStr & | Label = TStr() |
||
| ) |
Definition at line 259 of file gnuplot.cpp.
References TVec< TVal >::Add(), and TVec< TVal >::Len().
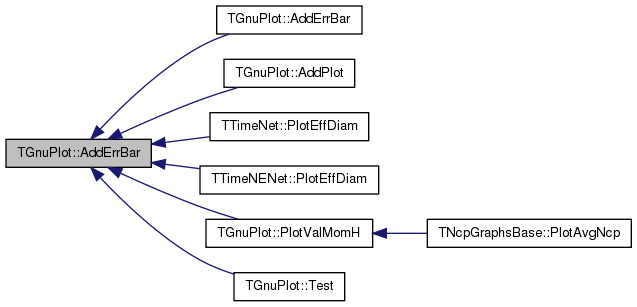
Referenced by AddErrBar(), AddPlot(), TTimeNet::PlotEffDiam(), TTimeNENet::PlotEffDiam(), PlotValMomH(), and Test().
                                                                 {
  TFltKdV XYFltValV(XYDValV.Len(), 0);
  TFltV DeltaV(XYDValV.Len(), 0);
  for (int i = 0; i < XYDValV.Len(); i++) {
    XYFltValV.Add(TFltKd(XYDValV[i].Val1, XYDValV[i].Val2));
    DeltaV.Add(XYDValV[i].Val3);
  }
  return AddErrBar(XYFltValV, DeltaV, Label);
}

| int TGnuPlot::AddErrBar | ( | const TFltTrV & | XYDValV, |
| const TStr & | DatLabel, | ||
| const TStr & | ErrLabel | ||
| ) |
Definition at line 269 of file gnuplot.cpp.
References TVec< TVal >::Add(), AddErrBar(), AddPlot(), gpwLinesPoints, and TVec< TVal >::Len().
                                                                                          {
  TFltKdV XYFltValV(XYDValV.Len(), 0);
  TFltV DeltaV(XYDValV.Len(), 0);
  for (int i = 0; i < XYDValV.Len(); i++) {
    XYFltValV.Add(TFltKd(XYDValV[i].Val1, XYDValV[i].Val2));
    DeltaV.Add(XYDValV[i].Val3);
  }
  const int PlotId = AddPlot(XYFltValV, gpwLinesPoints, DatLabel);
  AddErrBar(XYFltValV, DeltaV, ErrLabel);
  return PlotId;
}

| int TGnuPlot::AddErrBar | ( | const TFltV & | YValV, |
| const TFltV & | DeltaYV, | ||
| const TStr & | Label = TStr() |
||
| ) |
Definition at line 281 of file gnuplot.cpp.
References TVec< TVal >::Add(), AddErrBar(), IAssert, and TVec< TVal >::Len().
                                                                                   {
  IAssert(YValV.Len() == DeltaYV.Len());
  TFltKdV XYFltValV(YValV.Len(), 0);
  for (int i = 0; i < YValV.Len(); i++) {
    XYFltValV.Add(TFltKd(TFlt(i+1), YValV[i]));
  }
  return AddErrBar(XYFltValV, DeltaYV, Label);
}

| int TGnuPlot::AddErrBar | ( | const TFltV & | XValV, |
| const TFltV & | YValV, | ||
| const TFltV & | DeltaYV, | ||
| const TStr & | Label = TStr() |
||
| ) |
Definition at line 290 of file gnuplot.cpp.
References TVec< TVal >::Add(), AddErrBar(), IAssert, and TVec< TVal >::Len().
                                                                                                       {
  IAssert(XValV.Len() == YValV.Len());
  IAssert(XValV.Len() == DeltaYV.Len());
  TFltKdV XYFltValV(XValV.Len(), 0);
  for (int i = 0; i < XValV.Len(); i++) {
    XYFltValV.Add(TFltKd(XValV[i], YValV[i]));
  }
  return AddErrBar(XYFltValV, DeltaYV, Label);
}

| int TGnuPlot::AddErrBar | ( | const TFltPrV & | XYValV, |
| const TFltV & | DeltaYV, | ||
| const TStr & | Label = TStr() |
||
| ) |
Definition at line 300 of file gnuplot.cpp.
References TVec< TVal >::Add(), AddErrBar(), and TVec< TVal >::Len().
                                                                                      {
  TFltKdV XYFltValV(XYValV.Len(), 0);
  for (int i = 0; i < XYValV.Len(); i++) {
    XYFltValV.Add(TFltKd(XYValV[i].Val1, XYValV[i].Val2));
  }
  return AddErrBar(XYFltValV, DeltaYV, Label);
}

| int TGnuPlot::AddErrBar | ( | const TFltKdV & | XYValV, |
| const TFltV & | DeltaYV, | ||
| const TStr & | Label = TStr() |
||
| ) |
Definition at line 318 of file gnuplot.cpp.
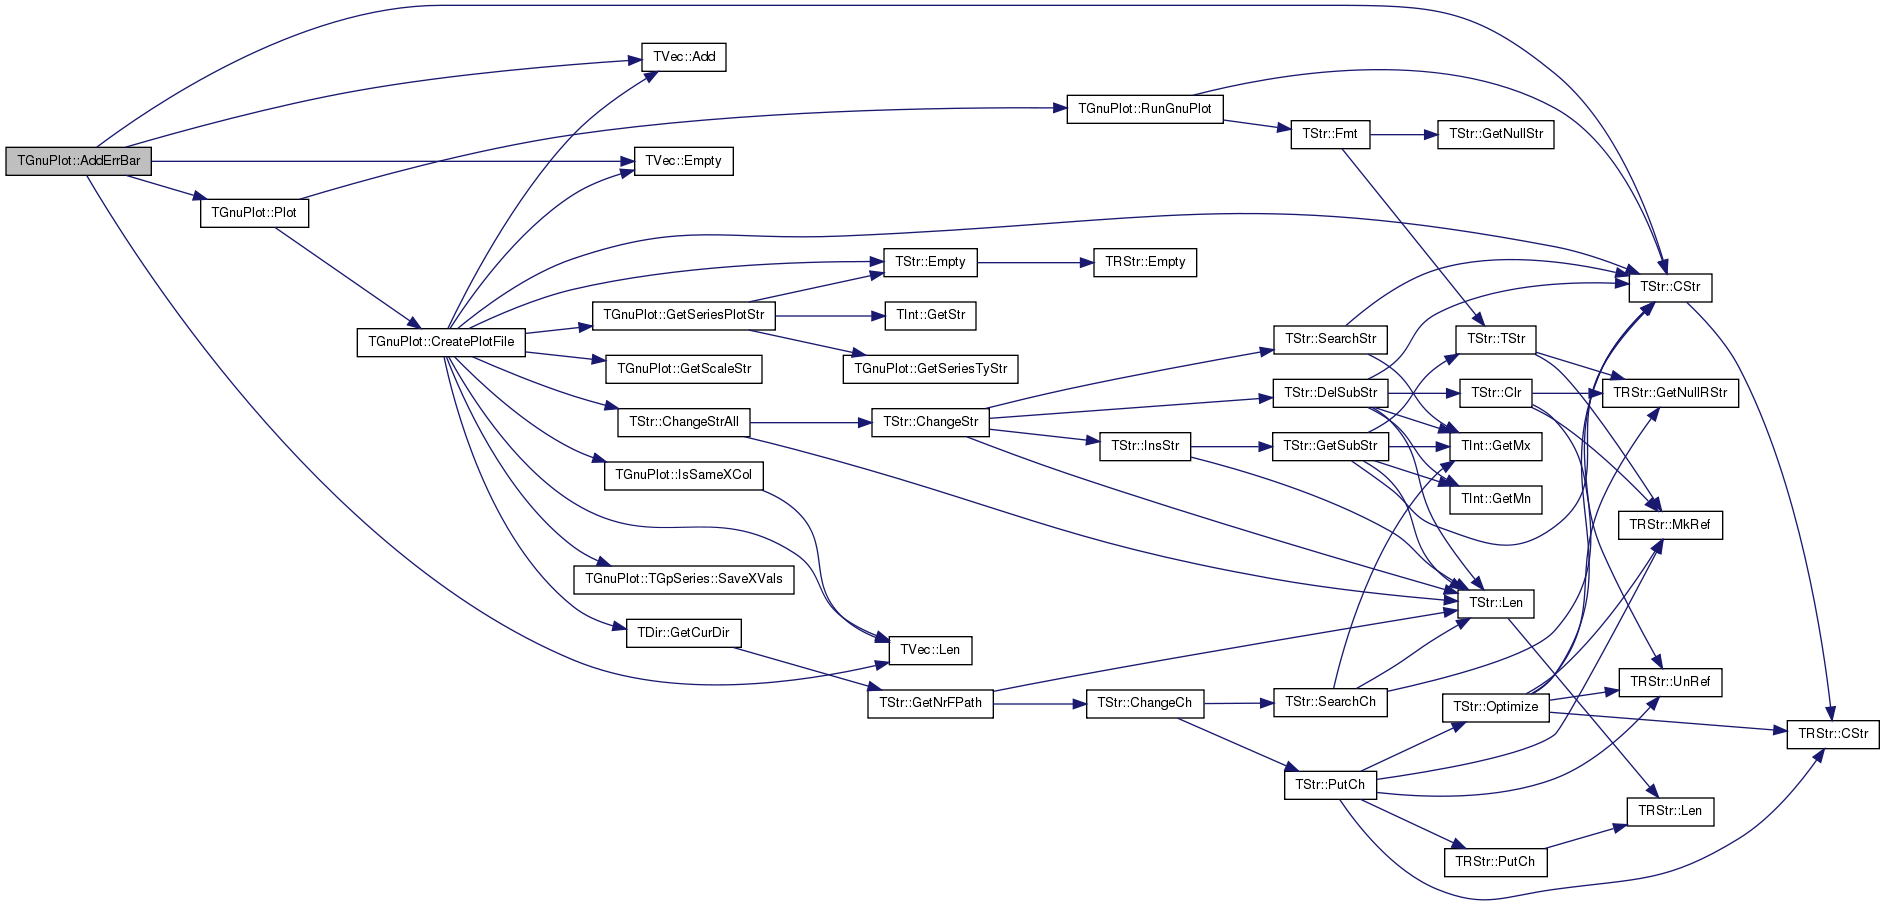
References TVec< TVal >::Add(), TStr::CStr(), DataFNm, TVec< TVal >::Empty(), gpwErrBars, IAssert, TVec< TVal >::Len(), Plot(), SeriesV, and Title.
                                                                                      {
  if (XYValV.Empty()) {
    printf("***AddErrBar: empty plot (%s) %s\n", DataFNm.CStr(), Title.CStr());
    return -1;
  }
  IAssert(XYValV.Len() == DeltaYV.Len());
  TGpSeries Plot;
  Plot.SeriesTy = gpwErrBars;
  Plot.Label = Label;
  Plot.XYValV = XYValV;
  Plot.ZValV = DeltaYV;
  SeriesV.Add(Plot);
  return SeriesV.Len() - 1;
}
| int TGnuPlot::AddErrBar | ( | const TFltPrV & | XYValV, |
| const TFltV & | DeltaYV, | ||
| const TStr & | DatLabel, | ||
| const TStr & | ErrLabel | ||
| ) |
Definition at line 308 of file gnuplot.cpp.
References TVec< TVal >::Add(), AddErrBar(), AddPlot(), gpwLinesPoints, and TVec< TVal >::Len().
                                                                                                              {
  TFltKdV XYFltValV(XYValV.Len(), 0);
  for (int i = 0; i < XYValV.Len(); i++) {
    XYFltValV.Add(TFltKd(XYValV[i].Val1, XYValV[i].Val2));
  }
  const int PlotId = AddPlot(XYFltValV, gpwLinesPoints, DatLabel);
  AddErrBar(XYFltValV, DeltaV, ErrLabel);
  return PlotId;
}
| int TGnuPlot::AddExpFit | ( | const int & | PlotId, |
| const TGpSeriesTy & | SeriesTy = gpwLines, |
||
| const double & | FitXOffset = 0.0, |
||
| const TStr & | Style = TStr() |
||
| ) |
!! skip zero values
Definition at line 544 of file gnuplot.cpp.
References TVec< TVal >::Add(), AddFunc(), TVec< TVal >::Empty(), TStr::Empty(), TSpecFunc::ExpFit(), TStr::Fmt(), TVec< TVal >::Len(), Plot(), SeriesV, and TGnuPlot::TGpSeries::XYValV.
                                                                                                                   {
  const TGpSeries& Plot = SeriesV[PlotId];
  if(Plot.XYValV.Empty()) return -1;
  const TFltKdV& XY = Plot.XYValV;
  double A, B, R2, SigA, SigB, Chi2;
  // power fit
  TFltPrV XYPr;
  int s;
  for (s = 0; s < XY.Len(); s++) {
    if (XY[s].Key-FitXOffset > 0) {
      XYPr.Add(TFltPr(XY[s].Key-FitXOffset, XY[s].Dat)); }
  }
  TSpecFunc::ExpFit(XYPr, A, B, SigA, SigB, Chi2, R2);
  TStr Label, StyleStr=Style;
  if (FitXOffset == 0) { Label = TStr::Fmt("%.4g exp(%.4g x)  R^2:%.2g", A, B, R2); }
  else { Label = TStr::Fmt("%.4g exp(%.4g x - %g)  R^2:%.2g", A, B, FitXOffset, R2); }
  if (StyleStr.Empty()) { StyleStr = "linewidth 3"; }
  const int FitId = AddFunc(TStr::Fmt("%f*exp(%f*x-%f)", A, B, FitXOffset),
    SeriesTy, Label, StyleStr);
  return FitId;
  /*SeriesV.Add();
  TGpSeries& NewPlot = SeriesV.Last();
  TFltKdV& EstXY = NewPlot.XYValV;
  for (s = 0; s < XYPr.Len(); s++) {
    EstXY.Add(TFltKd(XYPr[s].Val1+FitXOffset, A*exp(B*XYPr[s].Val1)));
  }
  NewPlot.SeriesTy = SeriesTy;
  if (Style.Empty()) { NewPlot.WithStyle = "linewidth 3"; }
  else { NewPlot.WithStyle = Style; }
  return SeriesV.Len() - 1;*/
}
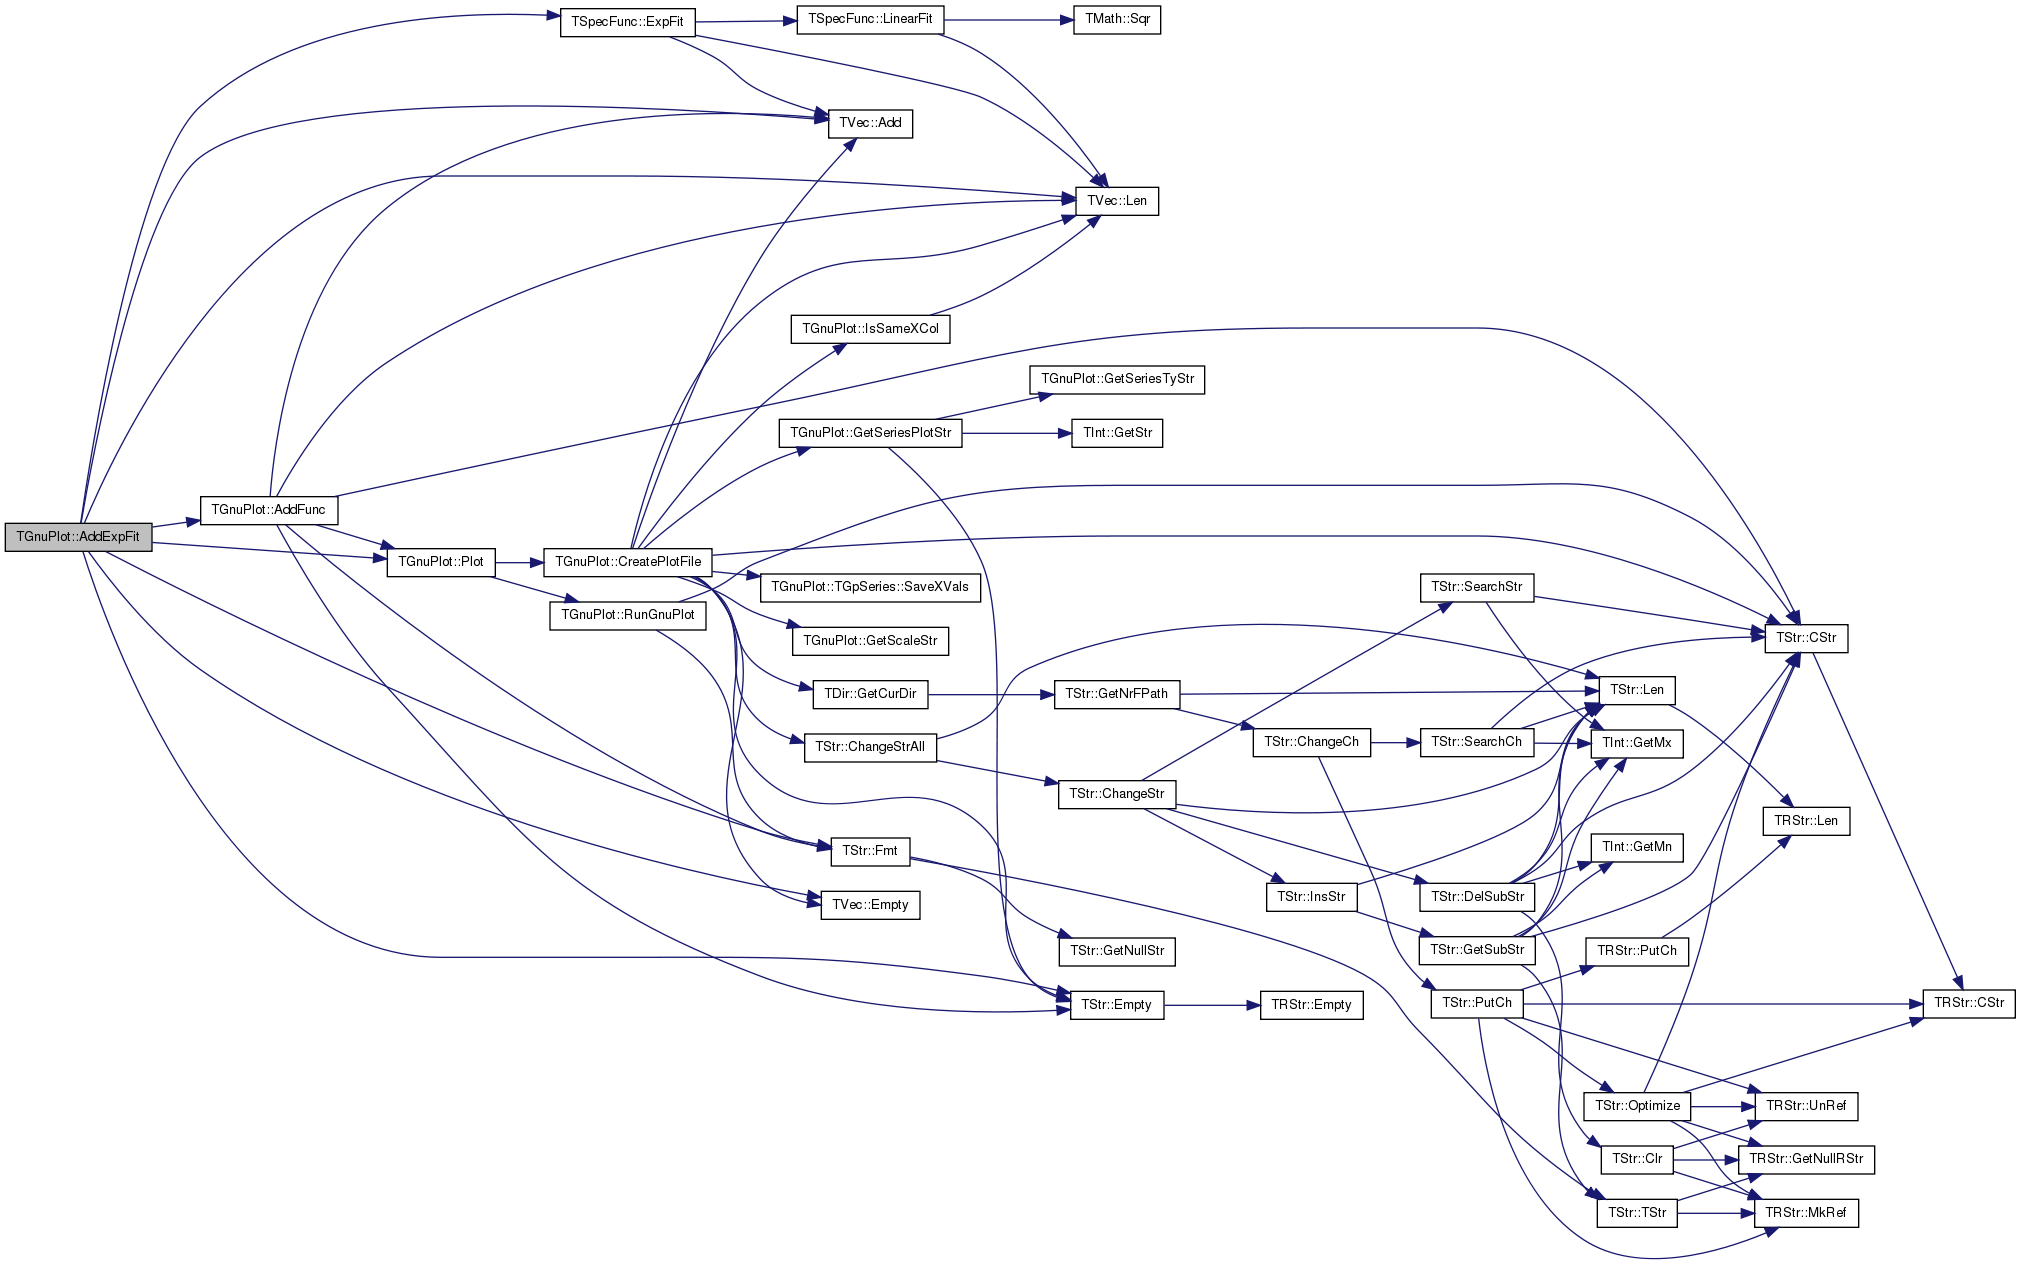
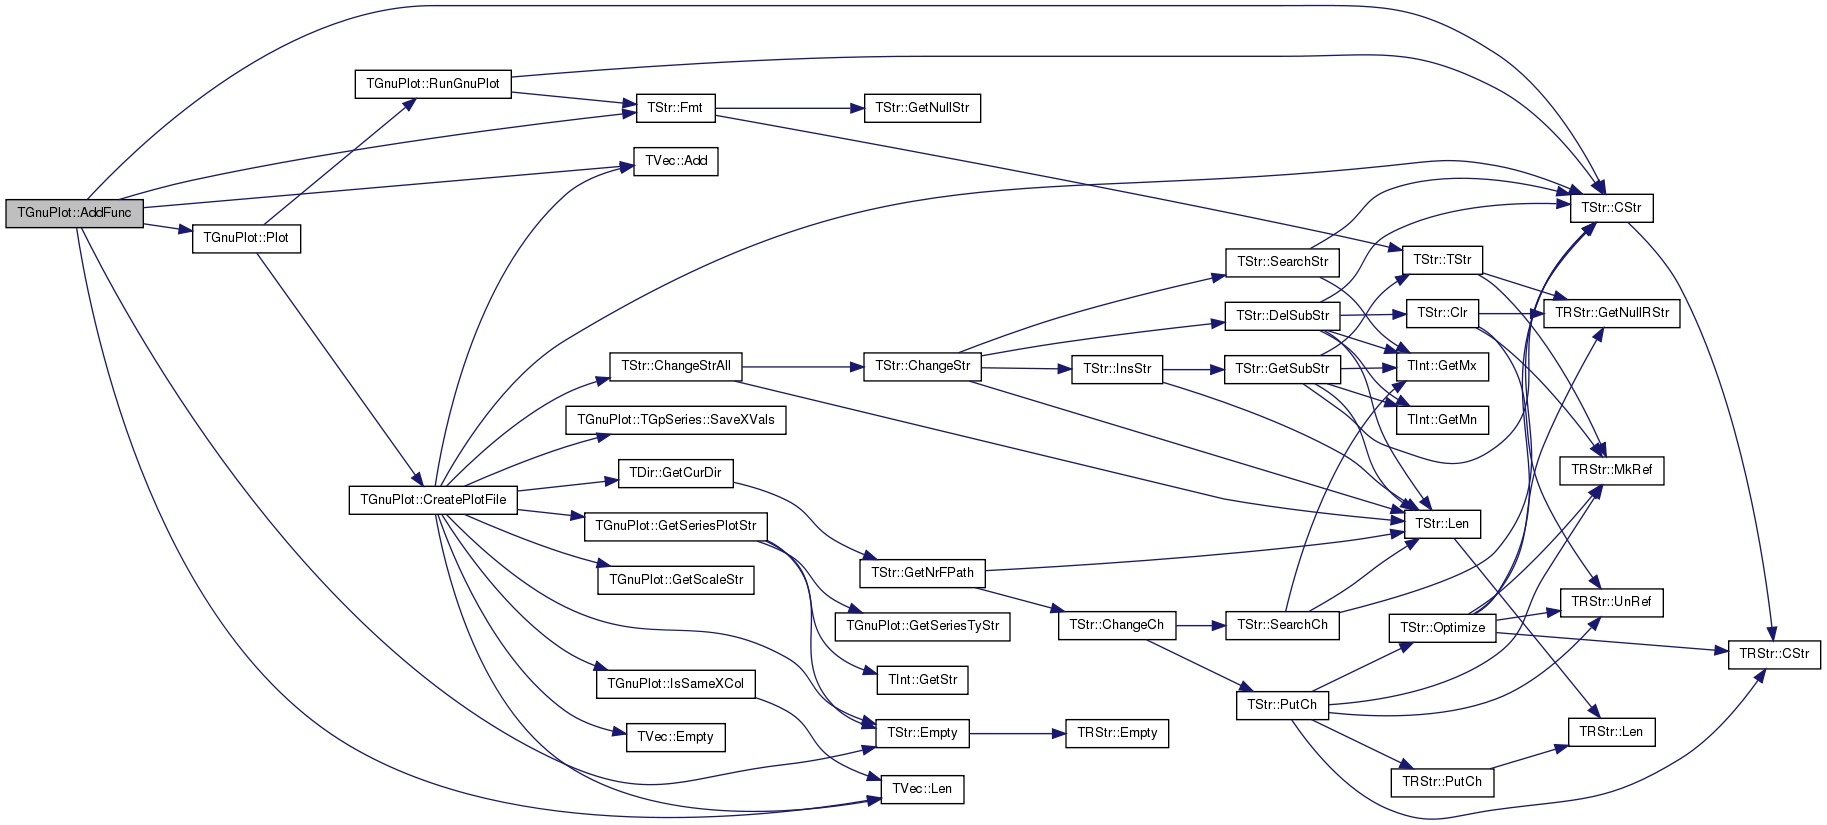
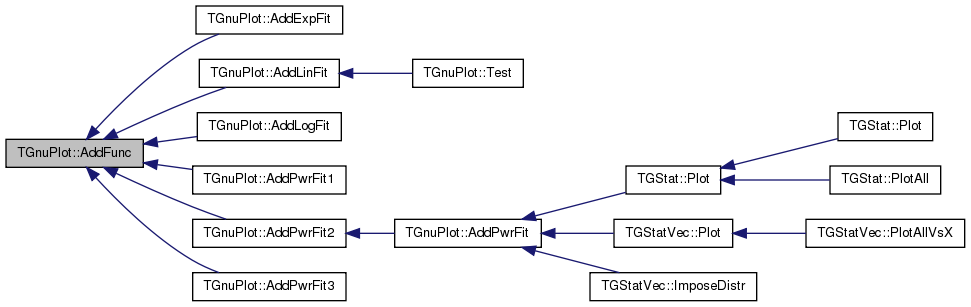
| int TGnuPlot::AddFunc | ( | const TStr & | FuncStr, |
| const TGpSeriesTy & | SeriesTy = gpwLinesPoints, |
||
| const TStr & | Label = TStr(), |
||
| const TStr & | Style = TStr() |
||
| ) |
Definition at line 149 of file gnuplot.cpp.
References TVec< TVal >::Add(), TStr::CStr(), TGnuPlot::TGpSeries::DataFNm, TStr::Empty(), TStr::Fmt(), TGnuPlot::TGpSeries::Label, TVec< TVal >::Len(), Plot(), TGnuPlot::TGpSeries::SeriesTy, SeriesV, TGnuPlot::TGpSeries::WithStyle, and TGnuPlot::TGpSeries::XCol.
Referenced by AddExpFit(), AddLinFit(), AddLogFit(), AddPwrFit1(), AddPwrFit2(), and AddPwrFit3().
                                                                                                            {
  const int Id = SeriesV.Len();
  TGpSeries Plot;
  Plot.SeriesTy = SeriesTy;
  Plot.Label = Label;
  if (! FuncStr.Empty()) { Plot.DataFNm = TStr::Fmt("f%d(x)=%s, f%d(x)", Id, FuncStr.CStr(), Id); }
  else { Plot.DataFNm = TStr::Fmt("f%d(x)", Id); }
  Plot.XCol = -1;
  Plot.WithStyle = Style;
  SeriesV.Add(Plot);
  return Id;
}
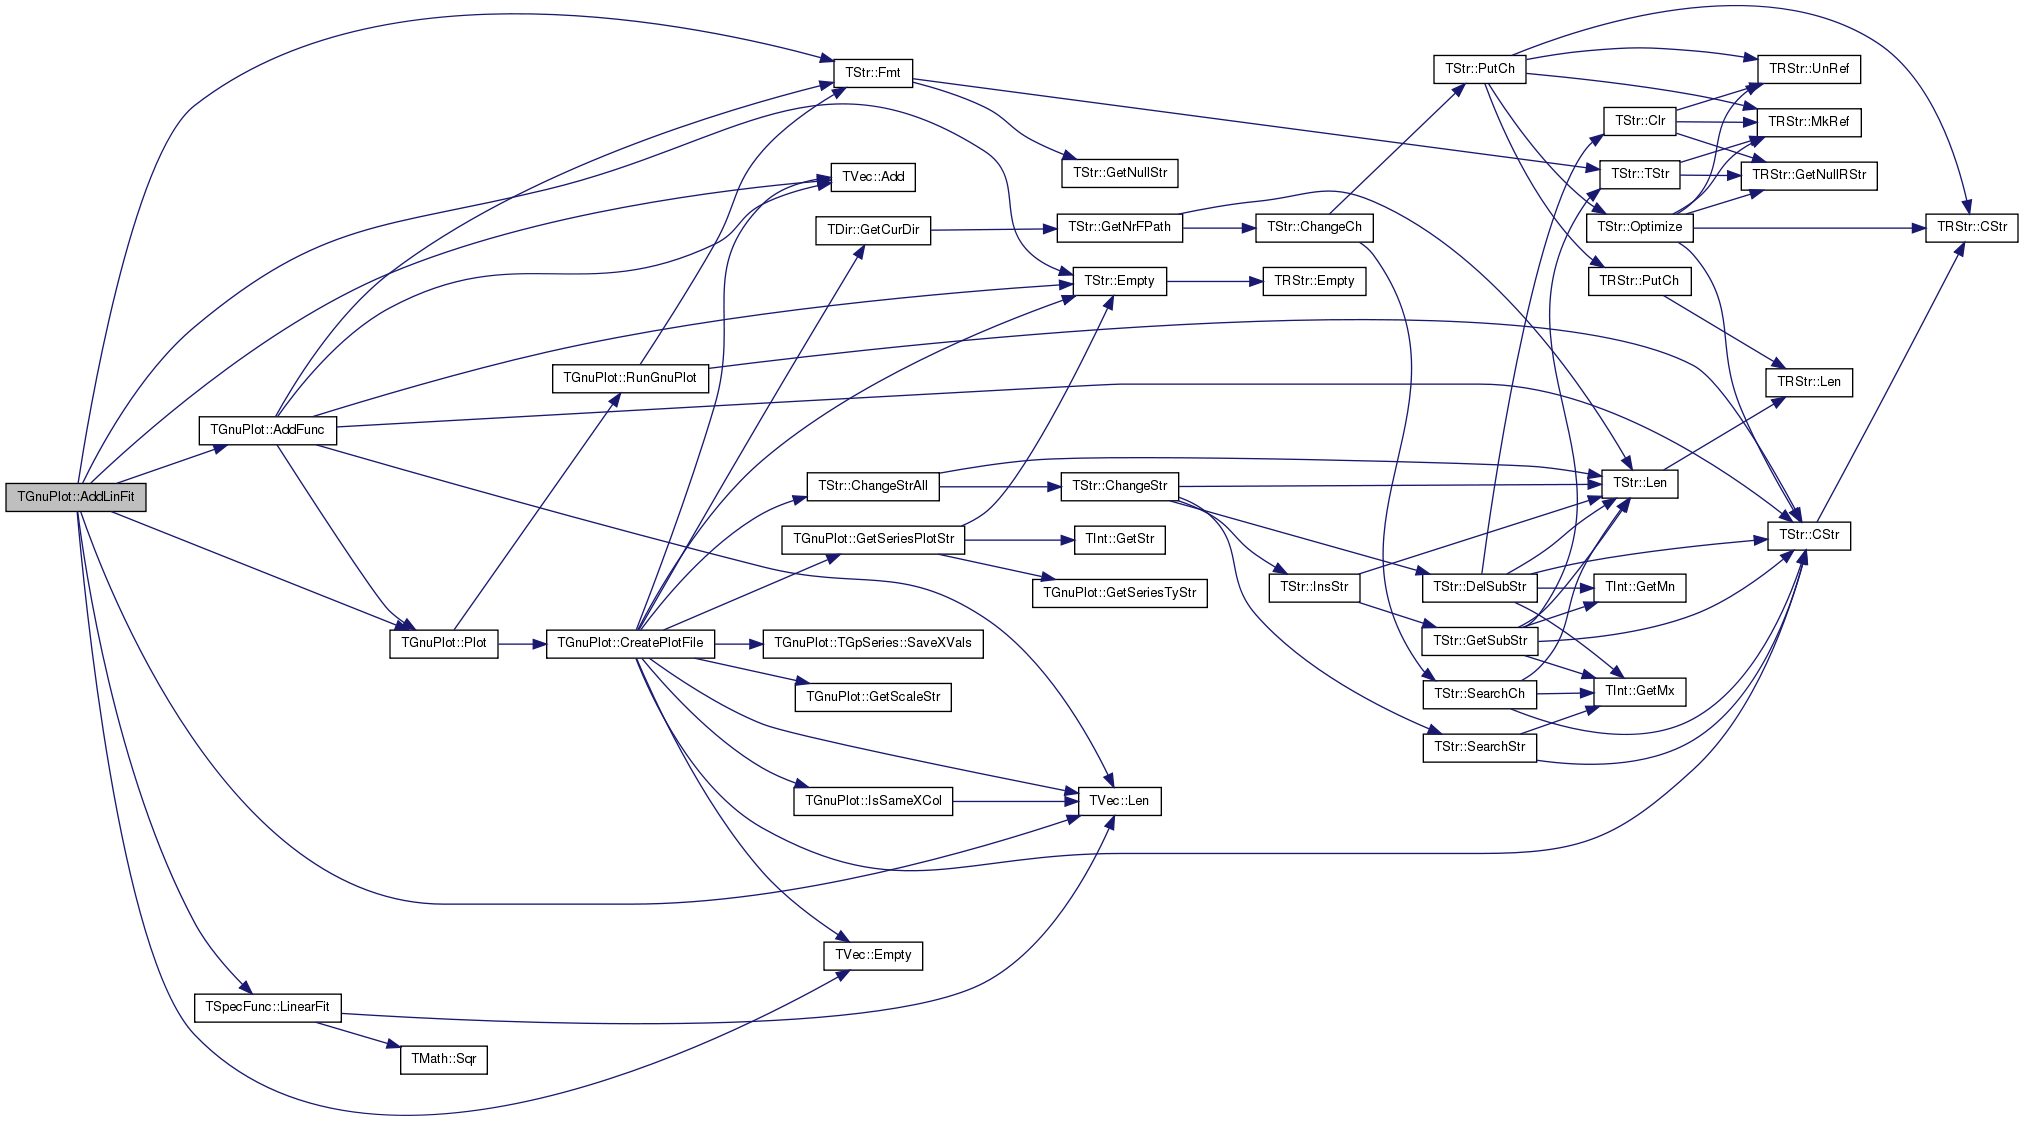
| int TGnuPlot::AddLinFit | ( | const int & | PlotId, |
| const TGpSeriesTy & | SeriesTy = gpwLines, |
||
| const TStr & | Style = TStr() |
||
| ) |
Definition at line 333 of file gnuplot.cpp.
References TVec< TVal >::Add(), AddFunc(), TVec< TVal >::Empty(), TStr::Empty(), TStr::Fmt(), TVec< TVal >::Len(), TSpecFunc::LinearFit(), Plot(), SeriesV, and TGnuPlot::TGpSeries::XYValV.
Referenced by Test().
                                                                                         {
  if (PlotId < 0 || PlotId >= SeriesV.Len()) return -1;
  const TGpSeries& Plot = SeriesV[PlotId];
  if(Plot.XYValV.Empty()) return -1;
  const TFltKdV& XY = Plot.XYValV;
  double A, B, R2, SigA, SigB, Chi2;
  // linear fit
  TFltPrV XYPr;
  int s;
  for (s = 0; s < XY.Len(); s++) {
    XYPr.Add(TFltPr(XY[s].Key, XY[s].Dat));
  }
  TSpecFunc::LinearFit(XYPr, A, B, SigA, SigB, Chi2, R2);
  TStr StyleStr=Style;
  if (StyleStr.Empty()) { StyleStr = "linewidth 3"; }
  const int FitId = AddFunc(TStr::Fmt("%f+%f*x", A, B),
    SeriesTy, TStr::Fmt("%.4g + %.4g x  R^2:%.2g", A, B, R2), StyleStr);
  return FitId;
  /*SeriesV.Add();
  TGpSeries& NewPlot = SeriesV.Last();
  TFltKdV& EstXY = NewPlot.XYValV;
  for (s = 0; s < XY.Len(); s++) {
    EstXY.Add(TFltKd(XY[s].Key, A + B*XYPr[s].Val1));
  }
  NewPlot.Label = TStr::Fmt("%.4g + %.4g x  R^2:%.2g", A, B, R2);
  NewPlot.SeriesTy = SeriesTy;
  if (Style.Empty()) { NewPlot.WithStyle = "linewidth 3"; }
  else { NewPlot.WithStyle = Style; }
  return SeriesV.Len() - 1;*/
}

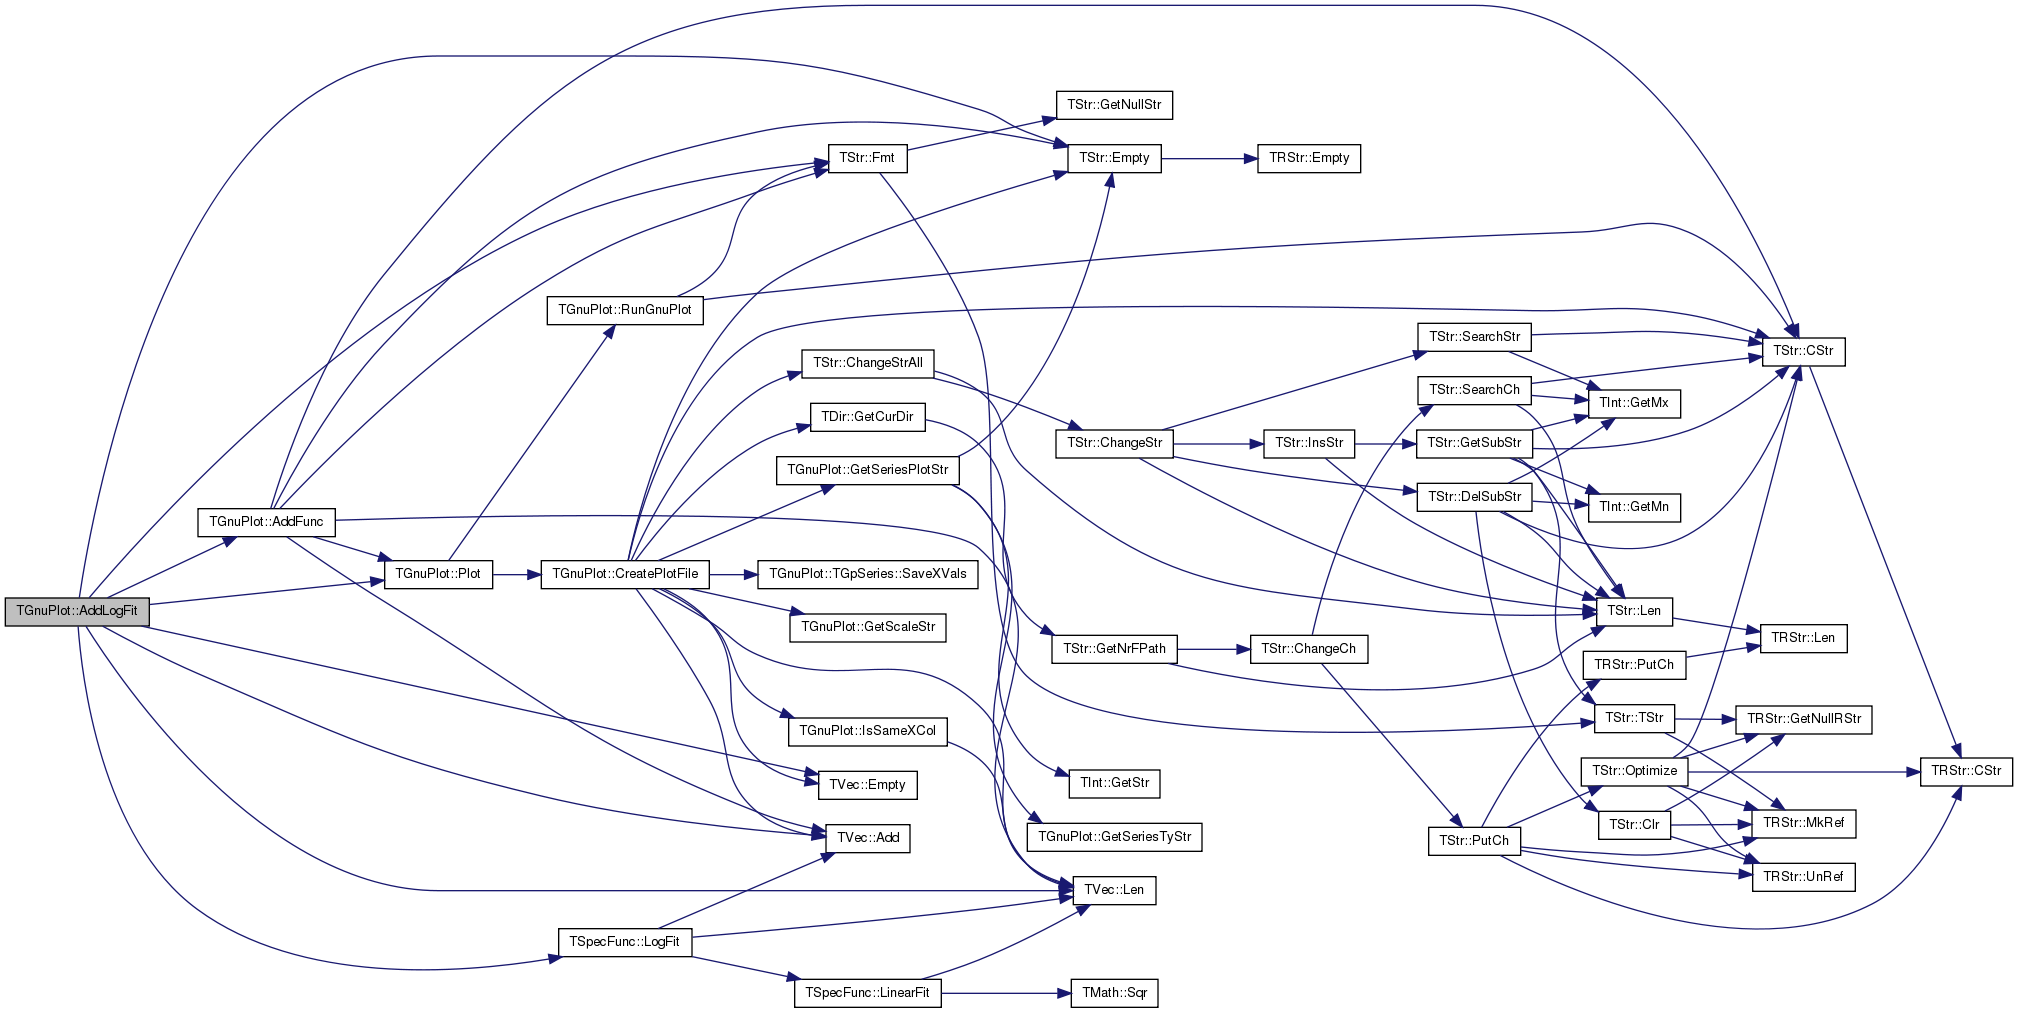
| int TGnuPlot::AddLogFit | ( | const int & | PlotId, |
| const TGpSeriesTy & | SeriesTy = gpwLines, |
||
| const TStr & | Style = TStr() |
||
| ) |
!! skip zero values
Definition at line 513 of file gnuplot.cpp.
References TVec< TVal >::Add(), AddFunc(), TVec< TVal >::Empty(), TStr::Empty(), TStr::Fmt(), TVec< TVal >::Len(), TSpecFunc::LogFit(), Plot(), SeriesV, and TGnuPlot::TGpSeries::XYValV.
                                                                                         {
  const TGpSeries& Plot = SeriesV[PlotId];
  if(Plot.XYValV.Empty()) return -1;
  const TFltKdV& XY = Plot.XYValV;
  double A, B, R2, SigA, SigB, Chi2;
  // power fit
  TFltPrV XYPr;
  int s;
  for (s = 0; s < XY.Len(); s++) {
    if (XY[s].Key > 0) {
      XYPr.Add(TFltPr(XY[s].Key, XY[s].Dat)); }
  }
  TSpecFunc::LogFit(XYPr, A, B, SigA, SigB, Chi2, R2);
  TStr StyleStr=Style;
  if (StyleStr.Empty()) { StyleStr = "linewidth 3"; }
  const int FitId = AddFunc(TStr::Fmt("%f+%f*log(x)", A, B),
    SeriesTy, TStr::Fmt("%.4g + %.4g log(x)  R^2:%.2g", A, B, R2), StyleStr);
  return FitId;
  /*SeriesV.Add();
  TGpSeries& NewPlot = SeriesV.Last();
  TFltKdV& EstXY = NewPlot.XYValV;
  for (s = 0; s < XYPr.Len(); s++) {
    EstXY.Add(TFltKd(XYPr[s].Val1, A+B*log((double)XYPr[s].Val1)));
  }
  NewPlot.Label = TStr::Fmt("%.4g + %.4g log(x)  R^2:%.2g", A, B, R2);
  NewPlot.SeriesTy = SeriesTy;
  if (Style.Empty()) { NewPlot.WithStyle = "linewidth 3"; }
  else { NewPlot.WithStyle = Style; }
  return SeriesV.Len() - 1;*/
}
| int TGnuPlot::AddPlot | ( | const TIntV & | YValV, |
| const TGpSeriesTy & | SeriesTy = gpwLinesPoints, |
||
| const TStr & | Label = TStr(), |
||
| const TStr & | Style = TStr() |
||
| ) |
Definition at line 180 of file gnuplot.cpp.
References TVec< TVal >::Add(), and TVec< TVal >::Len().
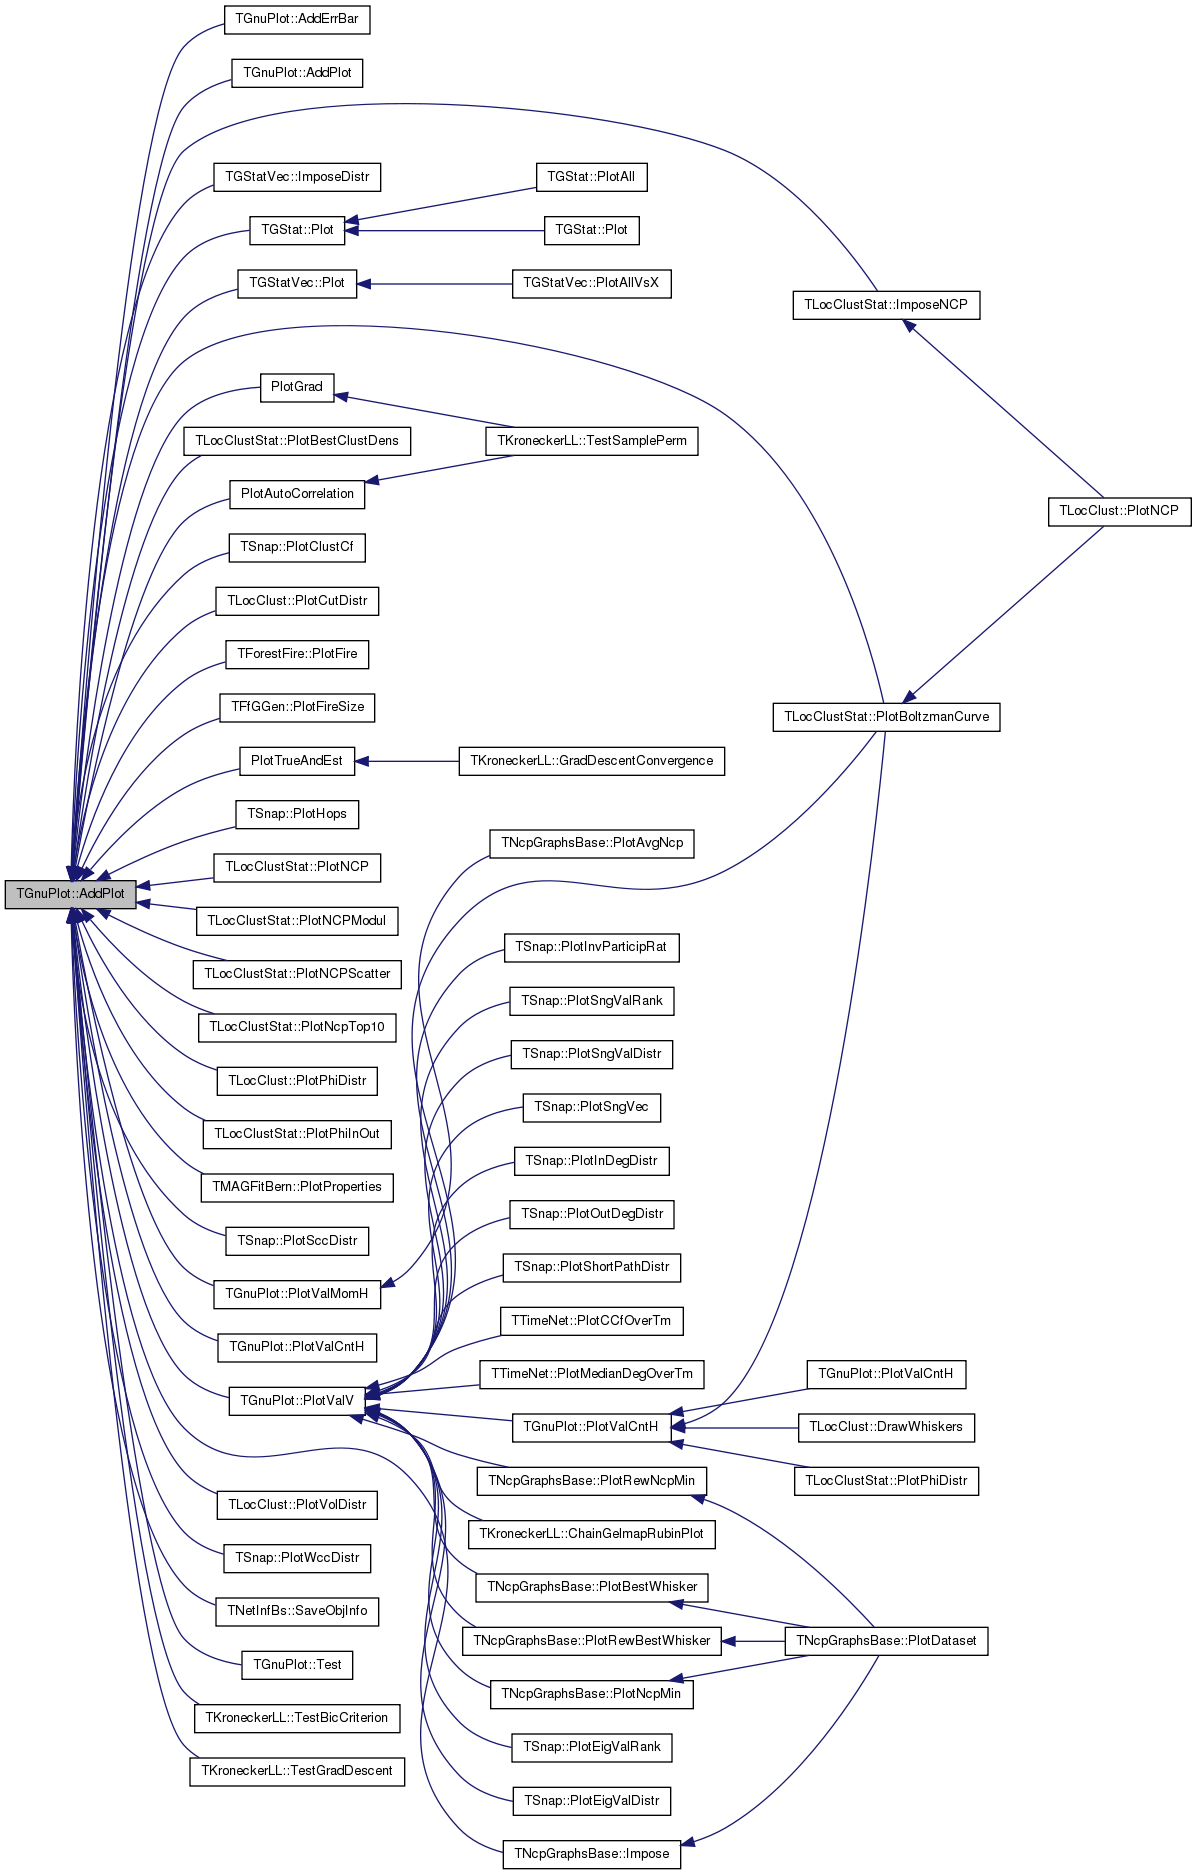
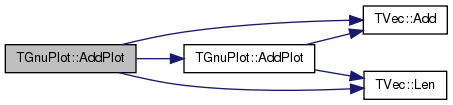
Referenced by AddErrBar(), AddPlot(), TNcpGraphsBase::Impose(), TGStatVec::ImposeDistr(), TLocClustStat::ImposeNCP(), TGStat::Plot(), TGStatVec::Plot(), PlotAutoCorrelation(), TLocClustStat::PlotBestClustDens(), TLocClustStat::PlotBoltzmanCurve(), TSnap::PlotClustCf(), TLocClust::PlotCutDistr(), TForestFire::PlotFire(), TFfGGen::PlotFireSize(), PlotGrad(), TSnap::PlotHops(), TLocClustStat::PlotNCP(), TLocClustStat::PlotNCPModul(), TLocClustStat::PlotNCPScatter(), TLocClustStat::PlotNcpTop10(), TLocClust::PlotPhiDistr(), TLocClustStat::PlotPhiInOut(), TMAGFitBern::PlotProperties(), TSnap::PlotSccDistr(), PlotTrueAndEst(), PlotValCntH(), PlotValMomH(), PlotValV(), TLocClust::PlotVolDistr(), TSnap::PlotWccDistr(), TNetInfBs::SaveObjInfo(), Test(), TKroneckerLL::TestBicCriterion(), and TKroneckerLL::TestGradDescent().
                                                                                                           {
  TFltKdV XYValV(YValV.Len(), 0);
  for (int i = 0; i < YValV.Len(); i++) {
    XYValV.Add(TFltKd(TFlt(i+1), TFlt(YValV[i])));
  }
  return AddPlot(XYValV, SeriesTy, Label, Style);
}

| int TGnuPlot::AddPlot | ( | const TFltV & | YValV, |
| const TGpSeriesTy & | SeriesTy = gpwLinesPoints, |
||
| const TStr & | Label = TStr(), |
||
| const TStr & | Style = TStr() |
||
| ) |
Definition at line 188 of file gnuplot.cpp.
References TVec< TVal >::Add(), AddPlot(), and TVec< TVal >::Len().
                                                                                                           {
  TFltKdV XYValV(YValV.Len(), 0);
  for (int i = 0; i < YValV.Len(); i++) {
    XYValV.Add(TFltKd(TFlt(i+1), TFlt(YValV[i])));
  }
  return AddPlot(XYValV, SeriesTy, Label, Style);
}
| int TGnuPlot::AddPlot | ( | const TFltV & | XValV, |
| const TFltV & | YValV, | ||
| const TGpSeriesTy & | SeriesTy = gpwLinesPoints, |
||
| const TStr & | Label = TStr(), |
||
| const TStr & | Style = TStr() |
||
| ) |
Definition at line 196 of file gnuplot.cpp.
References TVec< TVal >::Add(), AddPlot(), IAssert, and TVec< TVal >::Len().
                                                                                                                               {
  IAssert(XValV.Len() == YValV.Len());
  TFltKdV XYValV(XValV.Len(), 0);
  for (int i = 0; i < YValV.Len(); i++) {
    XYValV.Add(TFltKd(TFlt(XValV[i]), TFlt(YValV[i])));
  }
  return AddPlot(XYValV, SeriesTy, Label, Style);
}

| int TGnuPlot::AddPlot | ( | const TIntPrV & | XYValV, |
| const TGpSeriesTy & | SeriesTy = gpwLinesPoints, |
||
| const TStr & | Label = TStr(), |
||
| const TStr & | Style = TStr() |
||
| ) |
Definition at line 205 of file gnuplot.cpp.
References TVec< TVal >::Add(), AddPlot(), and TVec< TVal >::Len().
                                                                                                              {
  TFltKdV XYFltValV(XYValV.Len(), 0);
  for (int i = 0; i < XYValV.Len(); i++) {
    XYFltValV.Add(TFltKd(TFlt(XYValV[i].Val1), TFlt(XYValV[i].Val2)));
  }
  return AddPlot(XYFltValV, SeriesTy, Label, Style);
}

| int TGnuPlot::AddPlot | ( | const TFltPrV & | XYValV, |
| const TGpSeriesTy & | SeriesTy = gpwLinesPoints, |
||
| const TStr & | Label = TStr(), |
||
| const TStr & | Style = TStr() |
||
| ) |
Definition at line 213 of file gnuplot.cpp.
References TVec< TVal >::Add(), AddPlot(), and TVec< TVal >::Len().
                                                                                                              {
  TFltKdV XYFltValV(XYValV.Len(), 0);
  for (int i = 0; i < XYValV.Len(); i++) {
    XYFltValV.Add(TFltKd(XYValV[i].Val1, XYValV[i].Val2));
  }
  return AddPlot(XYFltValV, SeriesTy, Label, Style);
}

| int TGnuPlot::AddPlot | ( | const TIntKdV & | XYValV, |
| const TGpSeriesTy & | SeriesTy = gpwLinesPoints, |
||
| const TStr & | Label = TStr(), |
||
| const TStr & | Style = TStr() |
||
| ) |
Definition at line 221 of file gnuplot.cpp.
References TVec< TVal >::Add(), AddPlot(), and TVec< TVal >::Len().
                                                                                                              {
  TFltKdV XYFltValV(XYValV.Len(), 0);
  for (int i = 0; i < XYValV.Len(); i++) {
    XYFltValV.Add(TFltKd(TFlt(XYValV[i].Key), TFlt(XYValV[i].Dat)));
  }
  return AddPlot(XYFltValV, SeriesTy, Label, Style);
}

| int TGnuPlot::AddPlot | ( | const TFltKdV & | XYValV, |
| const TGpSeriesTy & | SeriesTy = gpwLinesPoints, |
||
| const TStr & | Label = TStr(), |
||
| const TStr & | Style = TStr() |
||
| ) |
Definition at line 245 of file gnuplot.cpp.
References TVec< TVal >::Add(), TStr::CStr(), DataFNm, TVec< TVal >::Empty(), TGnuPlot::TGpSeries::Label, TVec< TVal >::Len(), Plot(), TGnuPlot::TGpSeries::SeriesTy, SeriesV, Title, TGnuPlot::TGpSeries::WithStyle, and TGnuPlot::TGpSeries::XYValV.
                                                                                                              {
  if (XYValV.Empty()) {
    printf("***AddPlot: empty plot (%s) %s\n", DataFNm.CStr(), Title.CStr());
    return -1;
  }
  TGpSeries Plot;
  Plot.SeriesTy = SeriesTy;
  Plot.Label = Label;
  Plot.XYValV = XYValV;
  Plot.WithStyle = Style;
  SeriesV.Add(Plot);
  return SeriesV.Len() - 1;
}
| int TGnuPlot::AddPlot | ( | const TIntFltKdV & | XYValV, |
| const TGpSeriesTy & | SeriesTy = gpwLinesPoints, |
||
| const TStr & | Label = TStr(), |
||
| const TStr & | Style = TStr() |
||
| ) |
| int TGnuPlot::AddPlot | ( | const TIntFltPrV & | XYValV, |
| const TGpSeriesTy & | SeriesTy = gpwLinesPoints, |
||
| const TStr & | Label = TStr(), |
||
| const TStr & | Style = TStr() |
||
| ) |
| int TGnuPlot::AddPlot | ( | const TStr & | DataFNm, |
| const int & | ColY, | ||
| const TGpSeriesTy & | SeriesTy = gpwLinesPoints, |
||
| const TStr & | Label = TStr(), |
||
| const TStr & | Style = TStr() |
||
| ) |
Definition at line 162 of file gnuplot.cpp.
References AddPlot().
                                                                                         {
  return AddPlot(DataFNm, 0, ColY, SeriesTy, Label, Style);
}

| int TGnuPlot::AddPlot | ( | const TStr & | DataFNm, |
| const int & | ColX, | ||
| const int & | ColY, | ||
| const TGpSeriesTy & | SeriesTy = gpwLinesPoints, |
||
| const TStr & | Label = TStr(), |
||
| const TStr & | Style = TStr() |
||
| ) |
Definition at line 167 of file gnuplot.cpp.
References TVec< TVal >::Add(), TStr::ChangeStrAll(), TGnuPlot::TGpSeries::DataFNm, DataFNm, IAssert, TGnuPlot::TGpSeries::Label, TVec< TVal >::Len(), Plot(), TGnuPlot::TGpSeries::SeriesTy, SeriesV, TGnuPlot::TGpSeries::WithStyle, TGnuPlot::TGpSeries::XCol, TGnuPlot::TGpSeries::YCol, and TGnuPlot::TGpSeries::ZCol.
                                                                                         {
  IAssert(ColY > 0);  IAssert(ColX >= 0);
  TGpSeries Plot;
  Plot.SeriesTy = SeriesTy;
  Plot.Label = Label;
  Plot.DataFNm = DataFNm;  Plot.DataFNm.ChangeStrAll("\\", "\\\\");
  Plot.XCol = ColX;  Plot.YCol = ColY;  Plot.ZCol = 0;
  Plot.WithStyle = Style;
  SeriesV.Add(Plot);
  return SeriesV.Len() - 1;
}
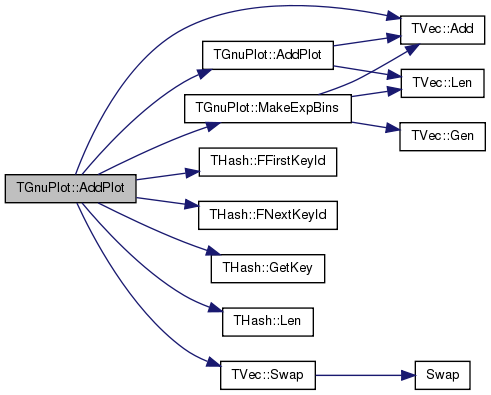
| int TGnuPlot::AddPlot | ( | const THash< TKey, TDat, THashFunc > & | XYValH, |
| const TGpSeriesTy & | SeriesTy = gpwLinesPoints, |
||
| const TStr & | Label = TStr(), |
||
| const TStr & | Style = TStr(), |
||
| const bool & | ExpBucket = false |
||
| ) |
Definition at line 235 of file gnuplot.h.
References TVec< TVal >::Add(), AddPlot(), THash< TKey, TDat, THashFunc >::FFirstKeyId(), THash< TKey, TDat, THashFunc >::FNextKeyId(), THash< TKey, TDat, THashFunc >::GetKey(), THash< TKey, TDat, THashFunc >::Len(), MakeExpBins(), and TVec< TVal >::Swap().
                                                                                                                                                          {
  TFltPrV XYFltValV(XYValH.Len(), 0);
  for (int k = XYValH.FFirstKeyId();  XYValH.FNextKeyId(k); ) {
    XYFltValV.Add(TFltPr(TFlt(XYValH.GetKey(k)), TFlt(XYValH[k])));
  }
  XYFltValV.Sort();
  if (ExpBucket) {
    TFltPrV BucketV;
    TGnuPlot::MakeExpBins(XYFltValV, BucketV);
    BucketV.Swap(XYFltValV);
  }
  return AddPlot(XYFltValV, SeriesTy, Label, Style);
}
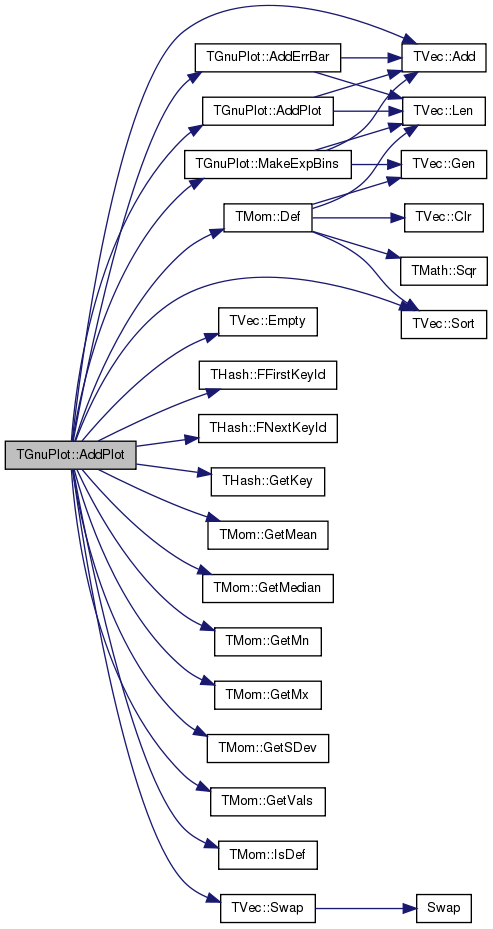
| int TGnuPlot::AddPlot | ( | const THash< TKey, TMom, THashFunc > & | ValMomH, |
| const TGpSeriesTy & | SeriesTy = gpwLinesPoints, |
||
| const TStr & | Label = TStr(), |
||
| const TStr & | Style = TStr(), |
||
| bool | PlotAvg = true, |
||
| bool | PlotMed = true, |
||
| bool | PlotMin = false, |
||
| bool | PlotMax = false, |
||
| bool | PlotSDev = false, |
||
| bool | PlotStdErr = false, |
||
| const bool & | ExpBucket = false |
||
| ) |
Definition at line 250 of file gnuplot.h.
References TVec< TVal >::Add(), AddErrBar(), AddPlot(), TMom::Def(), TVec< TVal >::Empty(), THash< TKey, TDat, THashFunc >::FFirstKeyId(), THash< TKey, TDat, THashFunc >::FNextKeyId(), THash< TKey, TDat, THashFunc >::GetKey(), TMom::GetMean(), TMom::GetMedian(), TMom::GetMn(), TMom::GetMx(), TMom::GetSDev(), TMom::GetVals(), TMom::IsDef(), MakeExpBins(), TVec< TVal >::Sort(), and TVec< TVal >::Swap().
                                                                                                                                                                                                                                                   {
  TFltTrV AvgV, StdErrV;
  TFltPrV AvgV2, MedV, MinV, MaxV, BucketV;
  for (int i = ValMomH.FFirstKeyId(); ValMomH.FNextKeyId(i); ) {
    TMom Mom(ValMomH[i]);
    if (! Mom.IsDef()) { Mom.Def(); }
    const double x = ValMomH.GetKey(i);
    if (PlotAvg) {
      if (PlotSDev) {
        AvgV.Add(TFltTr(x, Mom.GetMean(), Mom.GetSDev())); } // std deviation
      else {
        AvgV2.Add(TFltPr(x, Mom.GetMean()));
      }
      if (PlotStdErr) {
        StdErrV.Add(TFltTr(x, Mom.GetMean(), Mom.GetSDev()/sqrt((double)Mom.GetVals())));
      }
    }
    if (PlotMed) { MedV.Add(TFltPr(x, Mom.GetMedian())); }
    if (PlotMin) { MinV.Add(TFltPr(x, Mom.GetMn())); }
    if (PlotMax) { MaxV.Add(TFltPr(x, Mom.GetMx())); }
  }
  AvgV.Sort();  AvgV2.Sort();
  MedV.Sort();  MinV.Sort();  MaxV.Sort();
  int PlotId=0;
  // exponential bucketing
  if (! AvgV2.Empty()) { TGnuPlot::MakeExpBins(AvgV2, BucketV);  BucketV.Swap(AvgV2); }
  if (! MedV.Empty()) { TGnuPlot::MakeExpBins(MedV, BucketV);  BucketV.Swap(MedV); }
  if (! MinV.Empty()) { TGnuPlot::MakeExpBins(MinV, BucketV);  BucketV.Swap(MinV); }
  if (! MaxV.Empty()) { TGnuPlot::MakeExpBins(MaxV, BucketV);  BucketV.Swap(MaxV); }
  // plot
  if (! AvgV.Empty()) { PlotId = AddErrBar(AvgV, Label+" Average", "StdDev"); }
  if (! AvgV2.Empty()) { PlotId = AddPlot(AvgV2, SeriesTy, Label+" Average", Style); }
  if (! MedV.Empty()) { PlotId = AddPlot(MedV, SeriesTy, Label+" Median", Style); }
  if (! MinV.Empty()) { PlotId = AddPlot(MinV, SeriesTy, Label+" Min", Style); }
  if (! MaxV.Empty()) { PlotId = AddPlot(MaxV, SeriesTy, Label+" Max", Style); }
  if (! StdErrV.Empty()) { PlotId = AddErrBar(StdErrV, Label+" Standard error", Style); }
  return PlotId;
}
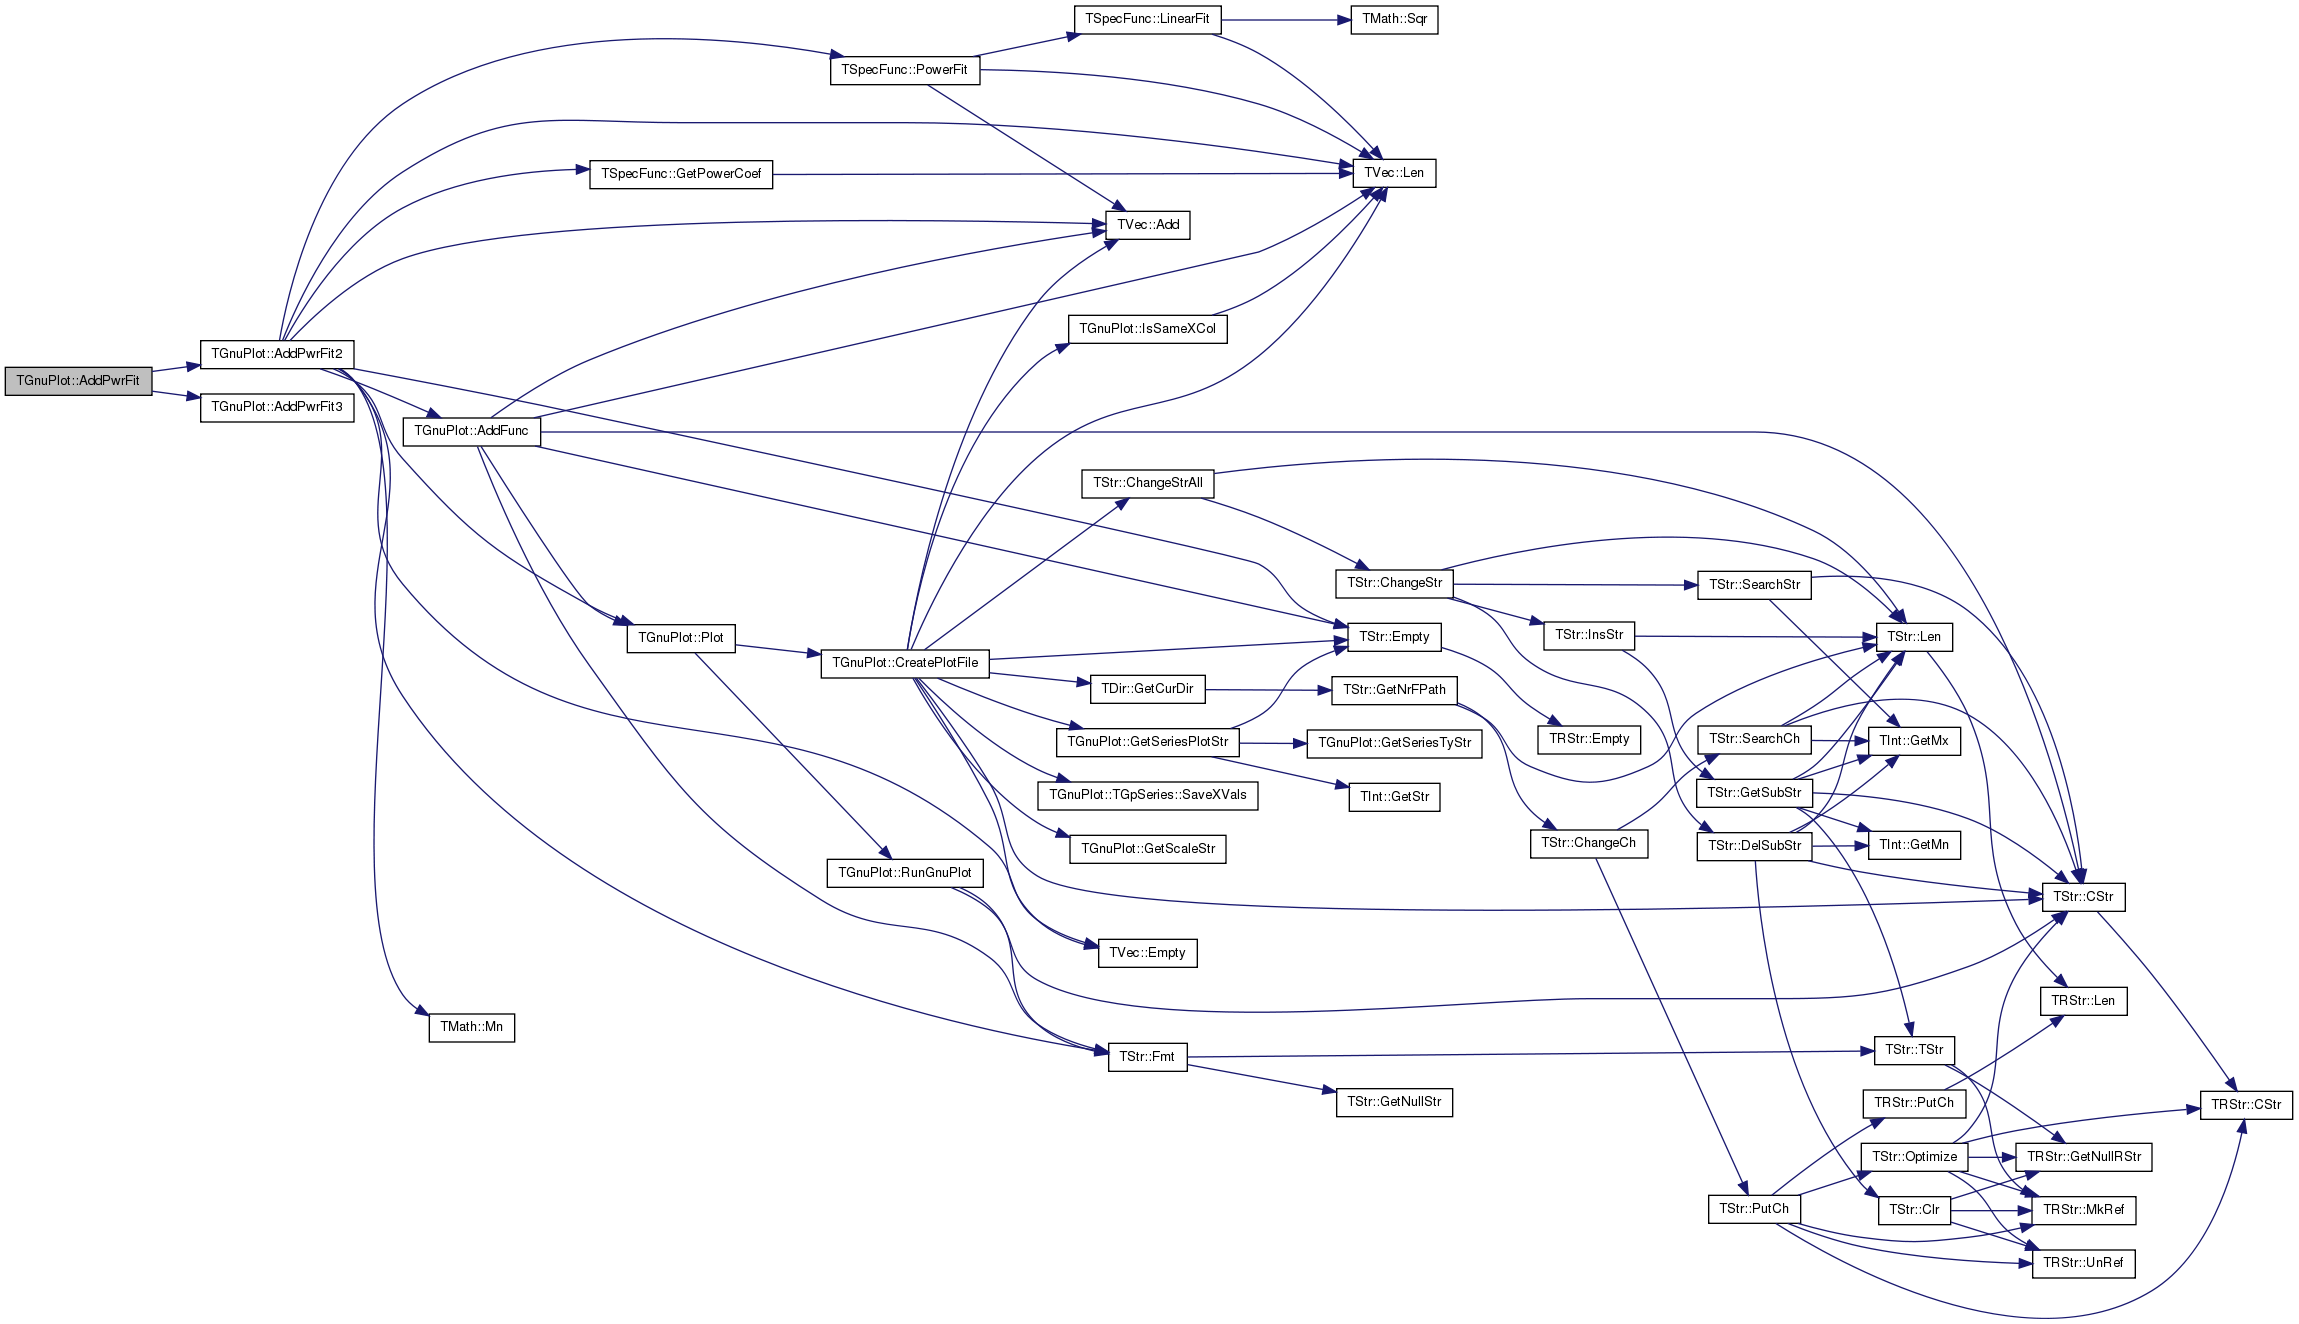
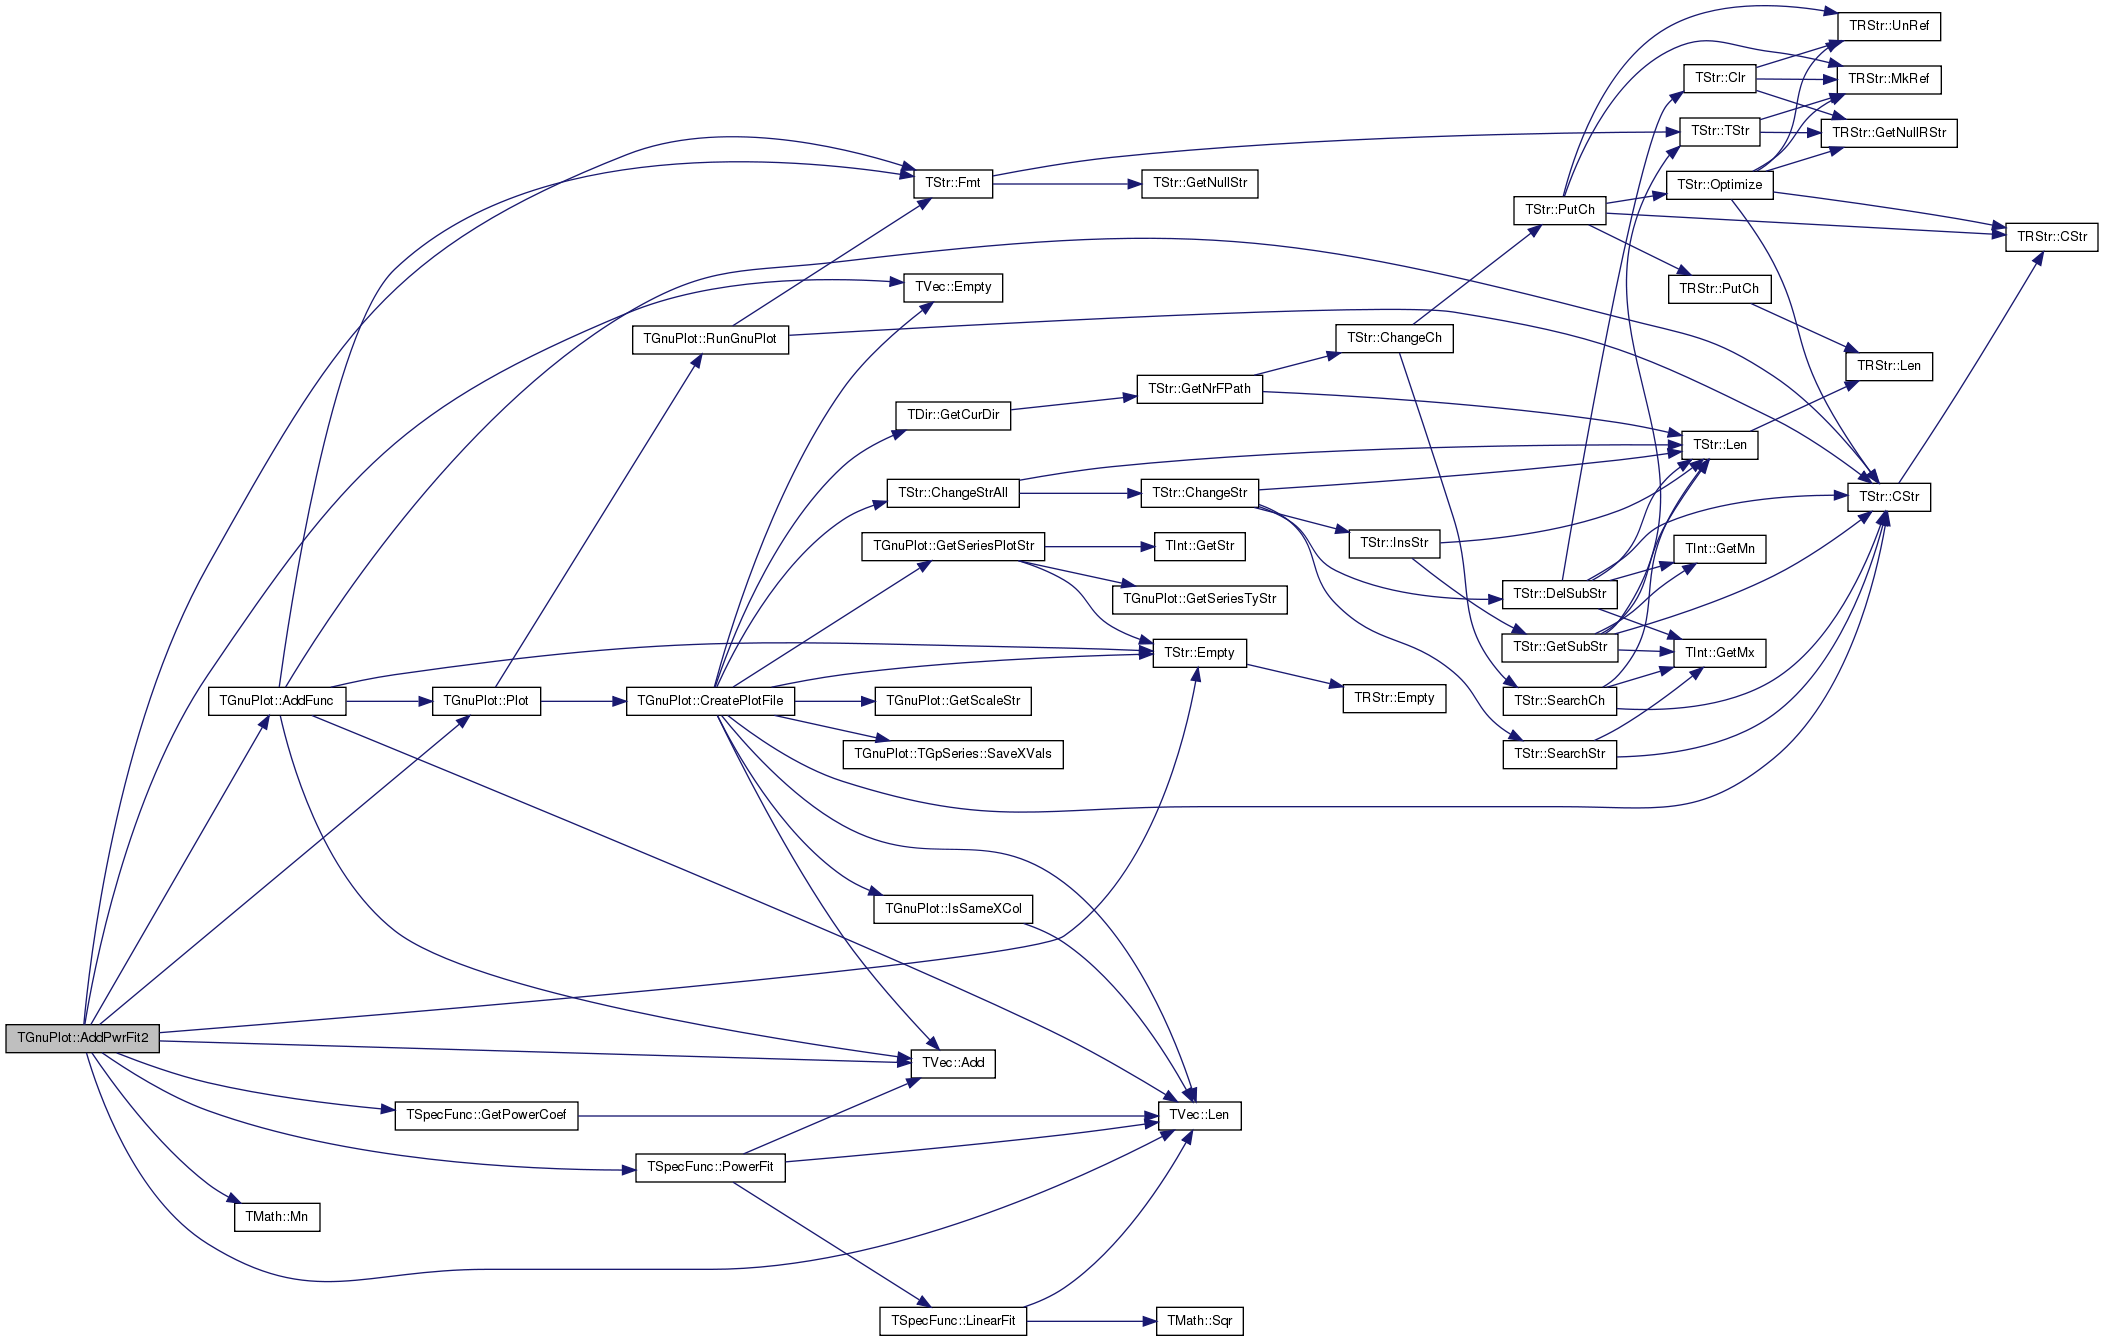
| int TGnuPlot::AddPwrFit | ( | const int & | PlotId, |
| const TGpSeriesTy & | SeriesTy = gpwLines, |
||
| const TStr & | Style = TStr() |
||
| ) |
Definition at line 364 of file gnuplot.cpp.
References AddPwrFit2(), and AddPwrFit3().
Referenced by TGStatVec::ImposeDistr(), TGStat::Plot(), and TGStatVec::Plot().
                                                                                         {
  const int PlotId1 = AddPwrFit3(PlotId, SeriesTy);
  AddPwrFit2(PlotId, SeriesTy, 5.0);
  return PlotId1;
}
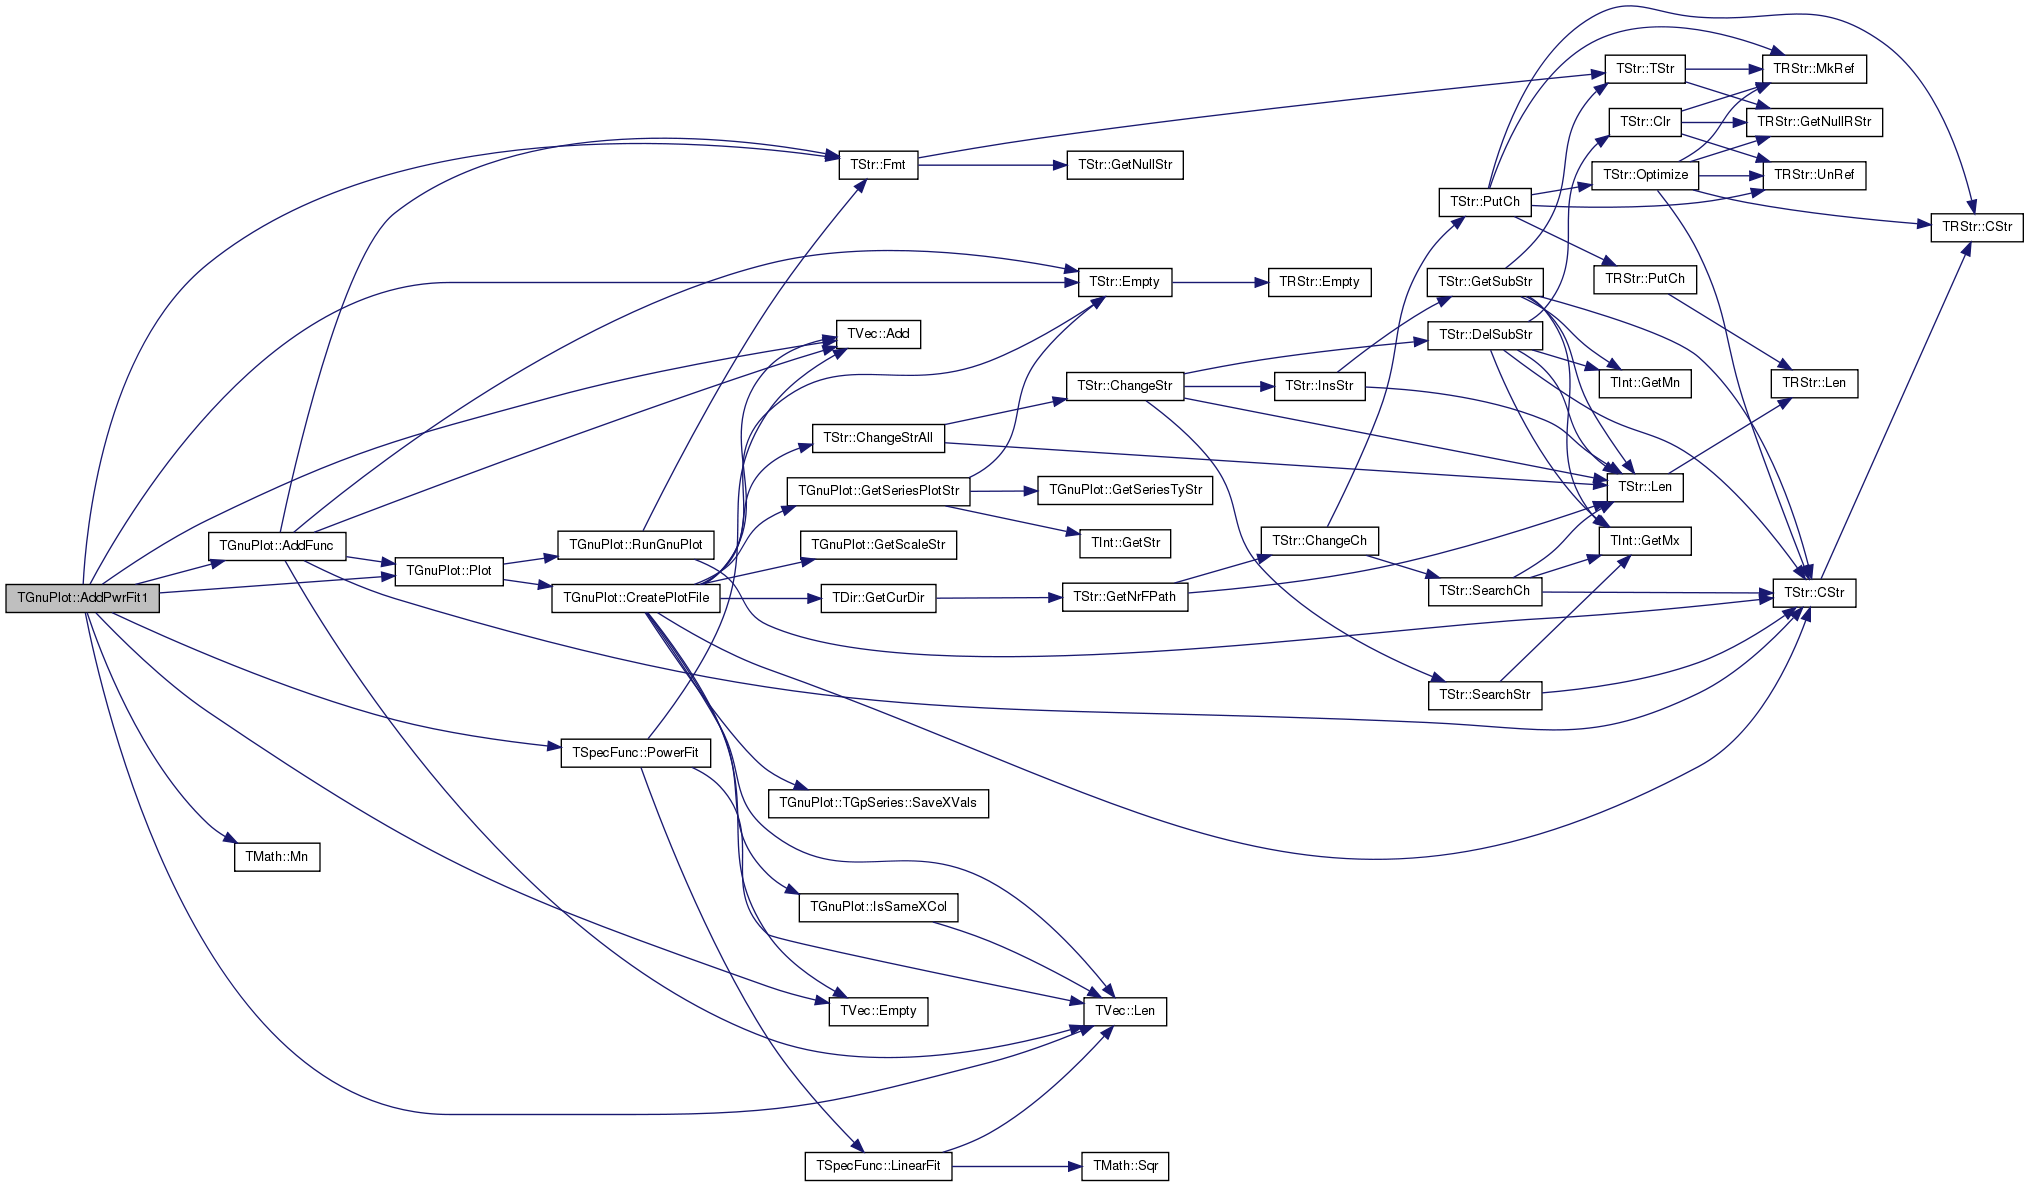
| int TGnuPlot::AddPwrFit1 | ( | const int & | PlotId, |
| const TGpSeriesTy & | SeriesTy = gpwLines, |
||
| const TStr & | Style = TStr() |
||
| ) |
!! skip zero values
Definition at line 371 of file gnuplot.cpp.
References TVec< TVal >::Add(), AddFunc(), TVec< TVal >::Empty(), TStr::Empty(), TStr::Fmt(), TVec< TVal >::Len(), TMath::Mn(), TFlt::Mx, Plot(), TSpecFunc::PowerFit(), SeriesV, and TGnuPlot::TGpSeries::XYValV.
                                                                                          {
  if (PlotId < 0 || PlotId >= SeriesV.Len()) return -1;
  const TGpSeries& Plot = SeriesV[PlotId];
  if(Plot.XYValV.Empty()) return -1;
  const TFltKdV& XY = Plot.XYValV;
  double A, B, R2, SigA, SigB, Chi2, MinY = TFlt::Mx, MinX = TFlt::Mx;
  // power fit
  TFltPrV XYPr;
  int s;
  for (s = 0; s < XY.Len(); s++) {
    if (XY[s].Key > 0) {
      XYPr.Add(TFltPr(XY[s].Key, XY[s].Dat));
      MinX = TMath::Mn(MinX, XY[s].Key());
      MinY = TMath::Mn(MinY, XY[s].Dat());
    }
  }
  MinY = TMath::Mn(1.0, MinY);
  TSpecFunc::PowerFit(XYPr, A, B, SigA, SigB, Chi2, R2);
  TStr StyleStr=Style;
  if (StyleStr.Empty()) { StyleStr = "linewidth 3"; }
  const int FitId = AddFunc(TStr::Fmt("%f*x**%f", A, B),
    SeriesTy, TStr::Fmt("%.1g * x^{%.4g}  R^2:%.2g", A, B, R2), StyleStr);
  return FitId;
  /*SeriesV.Add();
  TGpSeries& NewPlot = SeriesV.Last();
  const int FitId = SeriesV.Len() - 1;
  NewPlot.DataFNm = ;
  TFltKdV& EstXY = NewPlot.XYValV;
  for (s = 0; s < XYPr.Len(); s++) {
    const double YVal = A*pow(XYPr[s].Val1(), B);
    if (YVal < MinY) continue;
    EstXY.Add(TFltKd(XYPr[s].Val1, YVal));
  }
  NewPlot.Label = ;
  NewPlot.SeriesTy = SeriesTy;
  if (Style.Empty()) { NewPlot.WithStyle = "linewidth 3"; }
  else { NewPlot.WithStyle = Style; }
  //if (MinX < 5.0) MinX = 5.0;
  //AddPwrFit2(PlotId, SeriesTy, MinX);*/
}
| int TGnuPlot::AddPwrFit2 | ( | const int & | PlotId, |
| const TGpSeriesTy & | SeriesTy = gpwLines, |
||
| const double & | MinX = -1.0, |
||
| const TStr & | Style = TStr() |
||
| ) |
Definition at line 413 of file gnuplot.cpp.
References TVec< TVal >::Add(), AddFunc(), TVec< TVal >::Empty(), TStr::Empty(), TStr::Fmt(), TSpecFunc::GetPowerCoef(), TVec< TVal >::Len(), TMath::Mn(), TFlt::Mx, Plot(), TSpecFunc::PowerFit(), SeriesV, and TGnuPlot::TGpSeries::XYValV.
Referenced by AddPwrFit().
                                                                                                              {
  const TGpSeries& Plot = SeriesV[PlotId];
  if(Plot.XYValV.Empty()) return -1;
  const TFltKdV& XY = Plot.XYValV;
  // power fit
  TFltPrV XYPr;
  double MinY = TFlt::Mx;
  for (int s = 0; s < XY.Len(); s++) {
    if (XY[s].Key > 0.0) {
      XYPr.Add(TFltPr(XY[s].Key, XY[s].Dat));
      MinY = TMath::Mn(MinY, XY[s].Dat());
    }
  }
  if (XYPr.Empty()) return -1;
  MinY = TMath::Mn(1.0, MinY);
  // determine the sign of power coefficient
  double CoefSign = 0.0;
  { double A, B, R2, SigA, SigB, Chi2;
  TSpecFunc::PowerFit(XYPr, A, B, SigA, SigB, Chi2, R2);
  CoefSign = B > 0.0 ? +1.0 : -1.0; }
  const double PowerCf = CoefSign * TSpecFunc::GetPowerCoef(XYPr, MinX);
  int Mid = (int) exp(log((double)XYPr.Len())/2.0);
  if (Mid >= XYPr.Len()) { Mid = XYPr.Len()-1; }
  const double MidX = XYPr[Mid].Val1();
  const double MidY = XYPr[Mid].Val2();
  const double B = MidY / pow(MidX, PowerCf);
  TStr StyleStr=Style;
  if (StyleStr.Empty()) { StyleStr = "linewidth 3"; }
  const int FitId = AddFunc(TStr::Fmt("%f*x**%f", B, PowerCf),
    SeriesTy, TStr::Fmt("MLE = x^{%.4g}", PowerCf), StyleStr);
  return FitId;
  /*SeriesV.Add();
  TGpSeries& NewPlot = SeriesV.Last();
  TFltKdV& XYFit = NewPlot.XYValV;
  XYFit.Gen(XYPr.Len(), 0);
  for (int s = 0; s < XYPr.Len(); s++) {
    const double XVal = XYPr[s].Val1;
    const double YVal = B * pow(XYPr[s].Val1(), PowerCf);
    if (YVal < MinY || XVal < MinX) continue;
    XYFit.Add(TFltKd(XVal, YVal));
  }
  NewPlot.Label = TStr::Fmt("PowerFit: %g", PowerCf);
  NewPlot.SeriesTy = SeriesTy;
  if (Style.Empty()) { NewPlot.WithStyle = "linewidth 3"; }
  else { NewPlot.WithStyle = Style; }
  return SeriesV.Len() - 1;*/
}
| int TGnuPlot::AddPwrFit3 | ( | const int & | PlotId, |
| const TGpSeriesTy & | SeriesTy = gpwLines, |
||
| const double & | MinX = -1.0, |
||
| const TStr & | Style = TStr() |
||
| ) |
Definition at line 461 of file gnuplot.cpp.
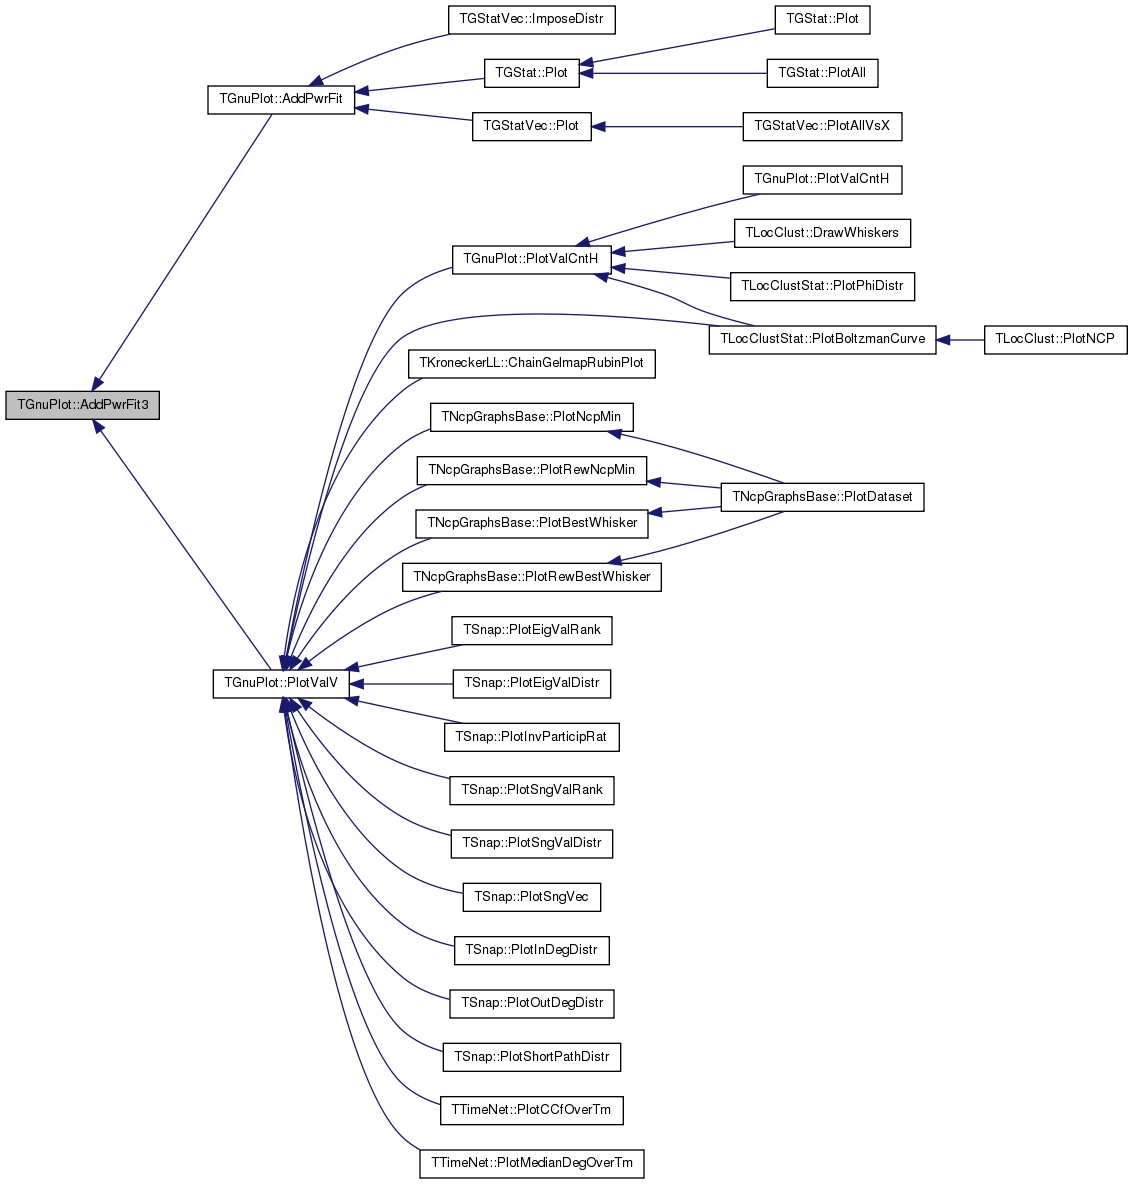
Referenced by AddPwrFit(), and PlotValV().
                                                                                                              {
  double Intercept, Slope, R2;
  return AddPwrFit3(PlotId, SeriesTy, MinX, Style, Intercept, Slope, R2);
}
| int TGnuPlot::AddPwrFit3 | ( | const int & | PlotId, |
| const TGpSeriesTy & | SeriesTy, | ||
| const double & | MinX, | ||
| const TStr & | Style, | ||
| double & | Intercept, | ||
| double & | Slope, | ||
| double & | R2 | ||
| ) |
!! skip zero values
Definition at line 467 of file gnuplot.cpp.
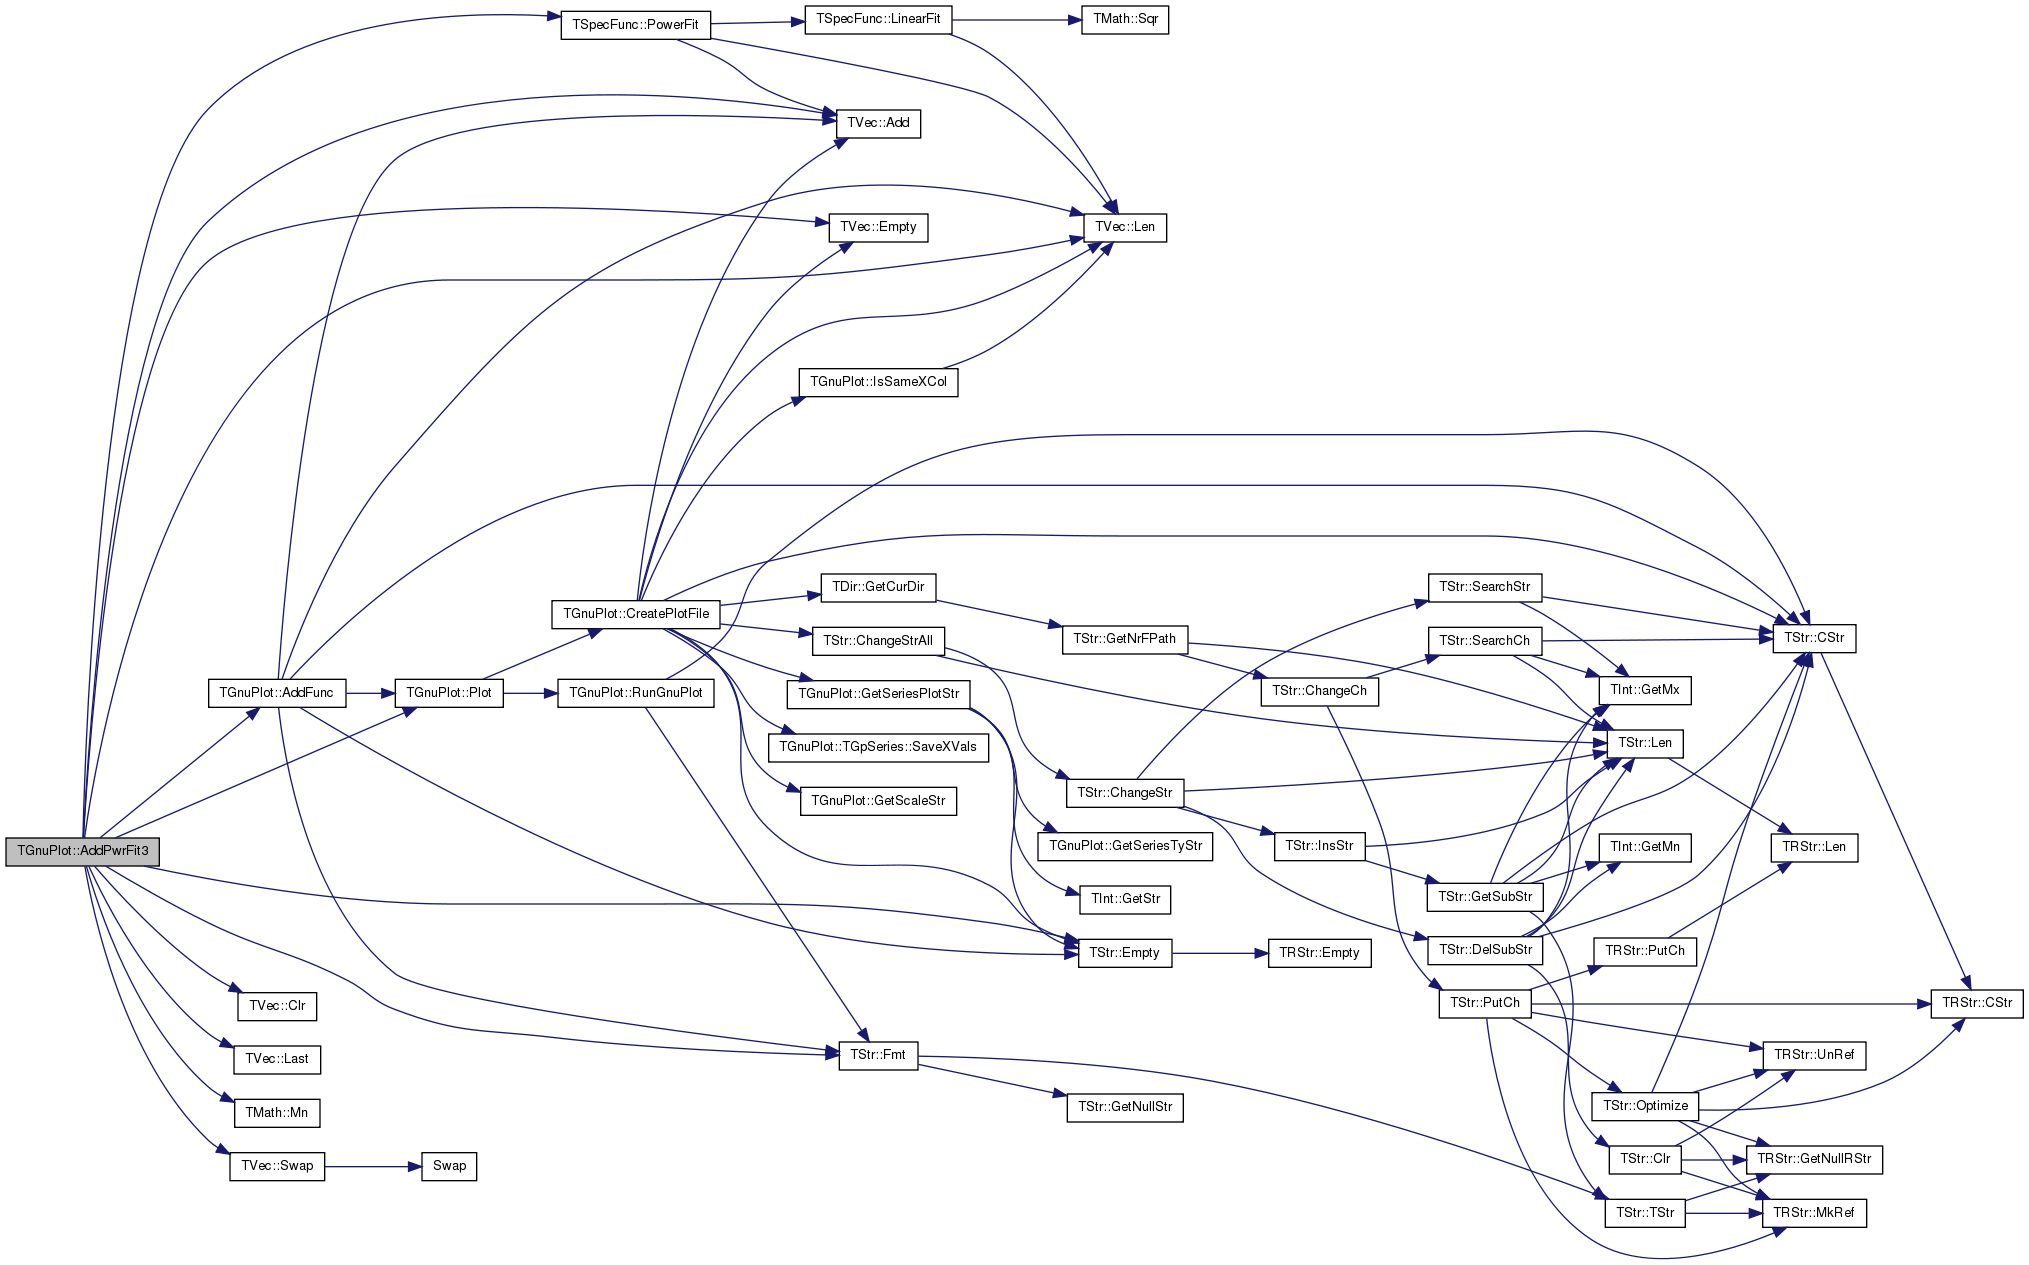
References TVec< TVal >::Add(), AddFunc(), TVec< TVal >::Clr(), TVec< TVal >::Empty(), TStr::Empty(), TStr::Fmt(), TVec< TVal >::Last(), TVec< TVal >::Len(), TMath::Mn(), TFlt::Mx, Plot(), TSpecFunc::PowerFit(), SeriesV, TVec< TVal >::Swap(), TPair< TVal1, TVal2 >::Val1, and TGnuPlot::TGpSeries::XYValV.
                                                                                                                                                            {
  if (PlotId < 0 || PlotId >= SeriesV.Len()) return -1;
  const TGpSeries& Plot = SeriesV[PlotId];
  if(Plot.XYValV.Empty()) return -1;
  double A, B, SigA, SigB, Chi2, MinY=TFlt::Mx;
  const TFltKdV& XY = Plot.XYValV;
  //SeriesV.Add();
  //TGpSeries& NewPlot = SeriesV.Last();
  //TFltKdV& EstXY = NewPlot.XYValV;
  TFltPrV FitXY, NewFitXY;
  for (int s = 0; s < XY.Len(); s++) {
    if (XY[s].Key > 0 && XY[s].Key >= MinX) {
      FitXY.Add(TFltPr(XY[s].Key, XY[s].Dat));
      MinY = TMath::Mn(MinY, XY[s].Dat());
    }
  }
  MinY = TMath::Mn(1.0, MinY);
  // power fit (if tail is too fat, cut everything where
  // extrapolation sets the value < MinY
  while (true) {
    TSpecFunc::PowerFit(FitXY, A, B, SigA, SigB, Chi2, R2);
    NewFitXY.Clr(false);
    //EstXY.Clr(false);
    for (int s = 0; s < FitXY.Len(); s++) {
      const double YVal = A*pow(FitXY[s].Val1(), B);
      if (YVal < MinY) continue;
      //EstXY.Add(TFltKd(FitXY[s].Val1, YVal));
      NewFitXY.Add(TFltPr(FitXY[s].Val1, FitXY[s].Val2));
    }
    if (NewFitXY.Len() < 10 || FitXY.Last().Val1 < 1.2 * NewFitXY.Last().Val1) { break; }
    else { FitXY.Swap(NewFitXY); }
  }
  TStr StyleStr=Style;
  if (StyleStr.Empty()) { StyleStr = "linewidth 3"; }
  const int FitId = AddFunc(TStr::Fmt("%f*x**%f", A, B),
    SeriesTy, TStr::Fmt("%.1g * x^{%.4g}  R^2:%.2g", A, B, R2), StyleStr);
  return FitId;
  /*NewPlot.Label = TStr::Fmt("%.1g * x^{%.4g}  R^2:%.2g", A, B, R2);
  Intercept = A;
  Slope = B;
  NewPlot.SeriesTy = SeriesTy;
  if (Style.Empty()) { NewPlot.WithStyle = "linewidth 3"; }
  else { NewPlot.WithStyle = Style; }
  return SeriesV.Len() - 1;*/
}
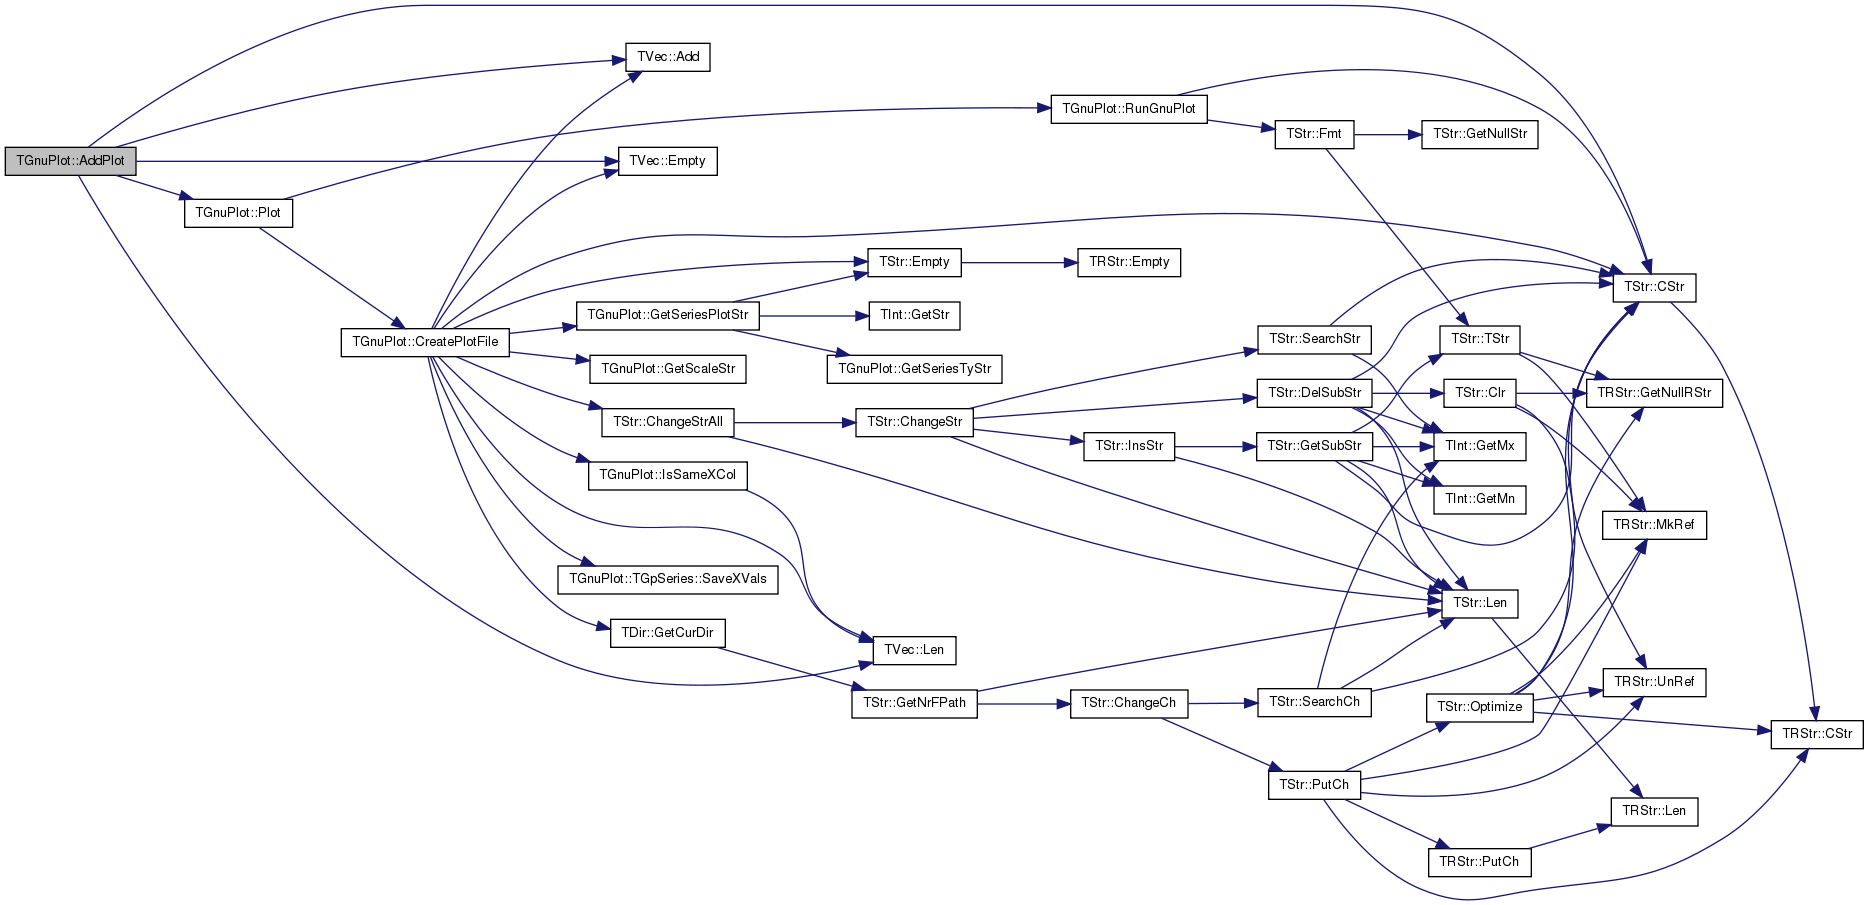
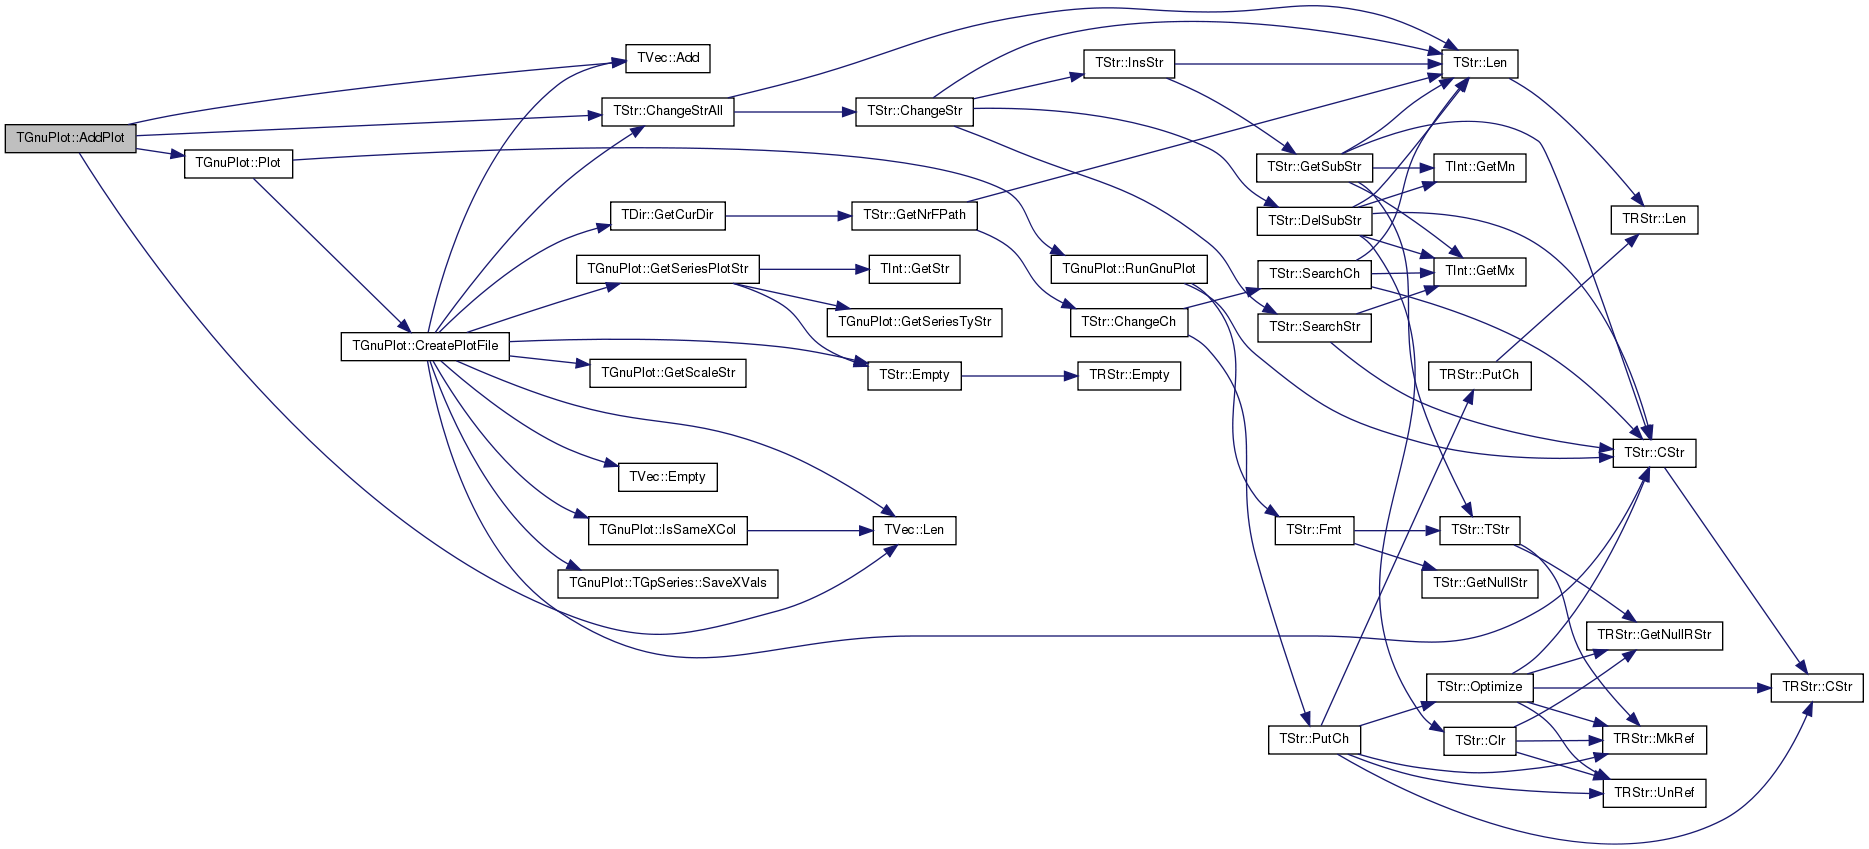
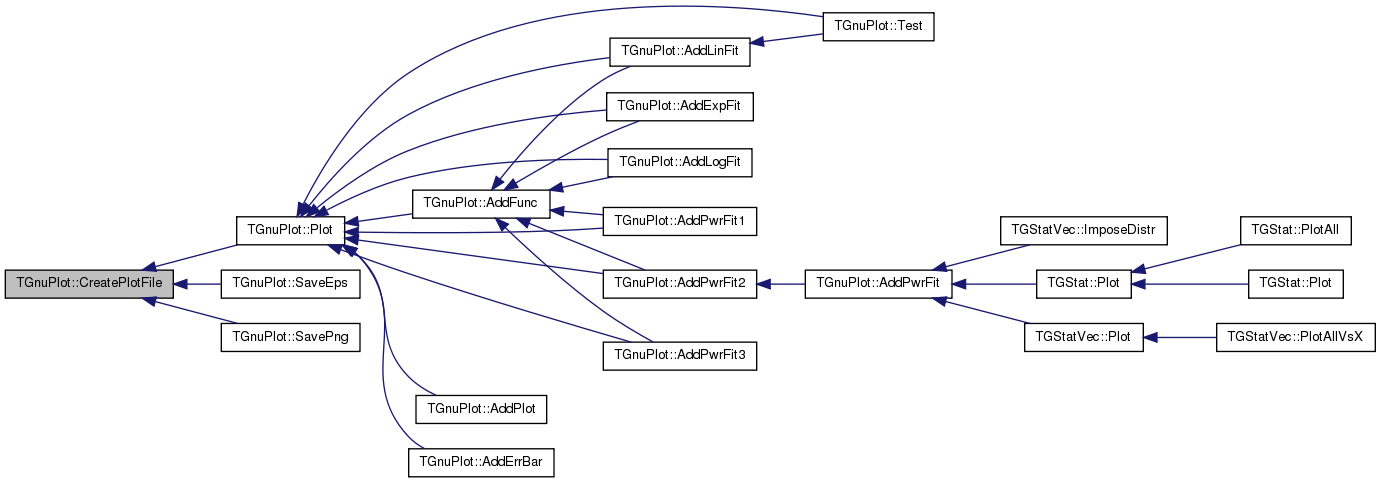
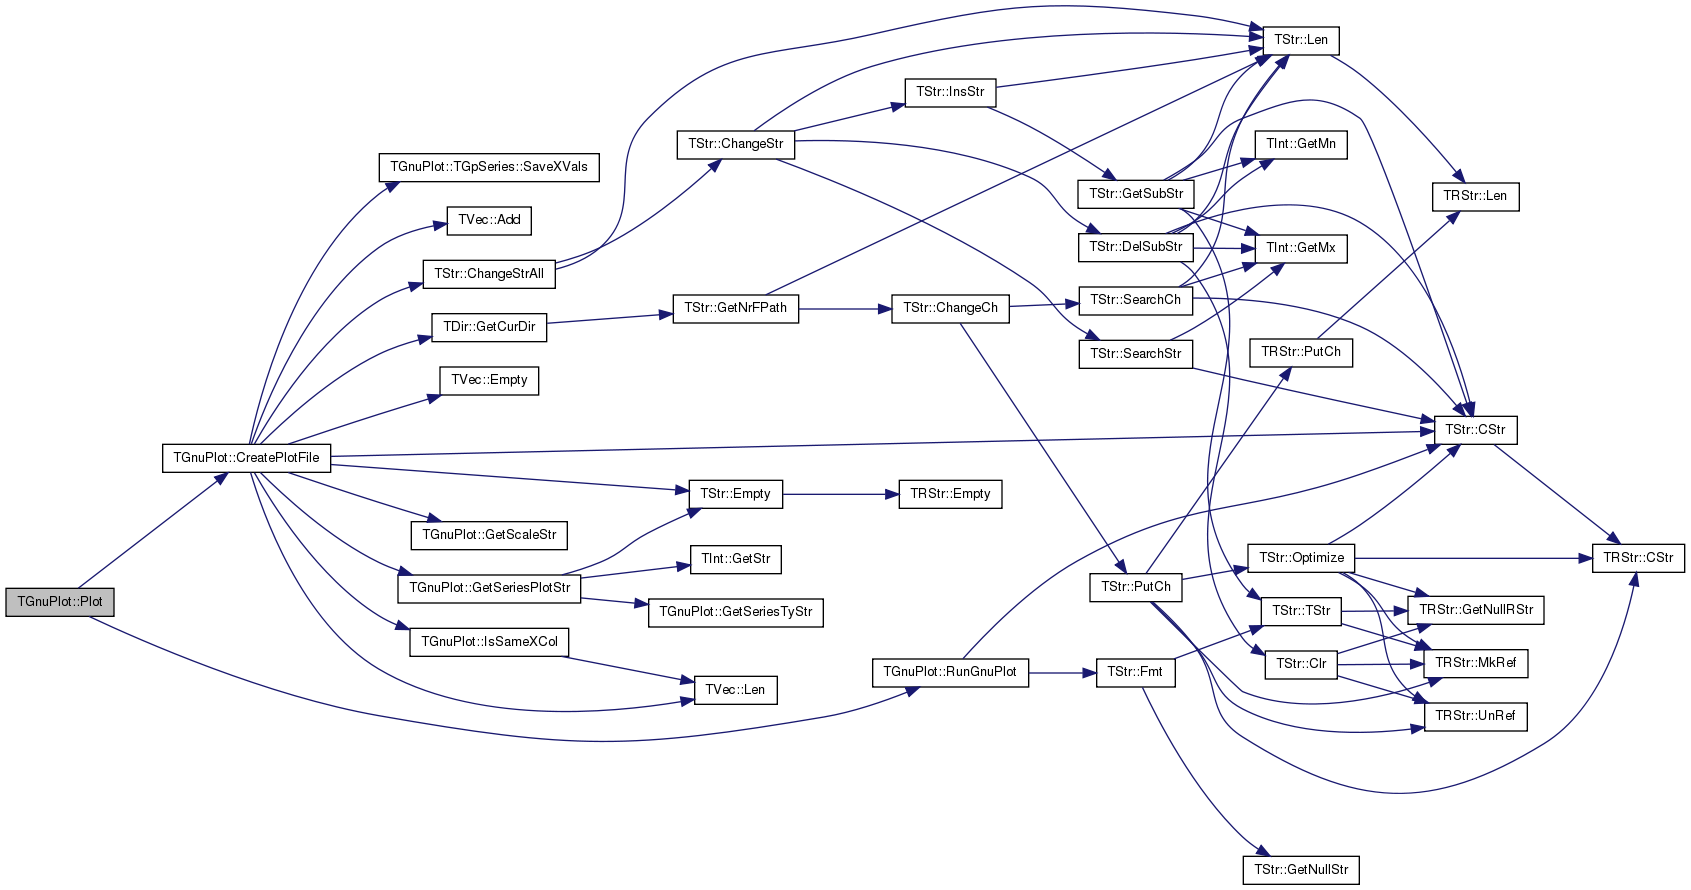
| void TGnuPlot::CreatePlotFile | ( | const TStr & | Comment = TStr() | ) |
Definition at line 762 of file gnuplot.cpp.
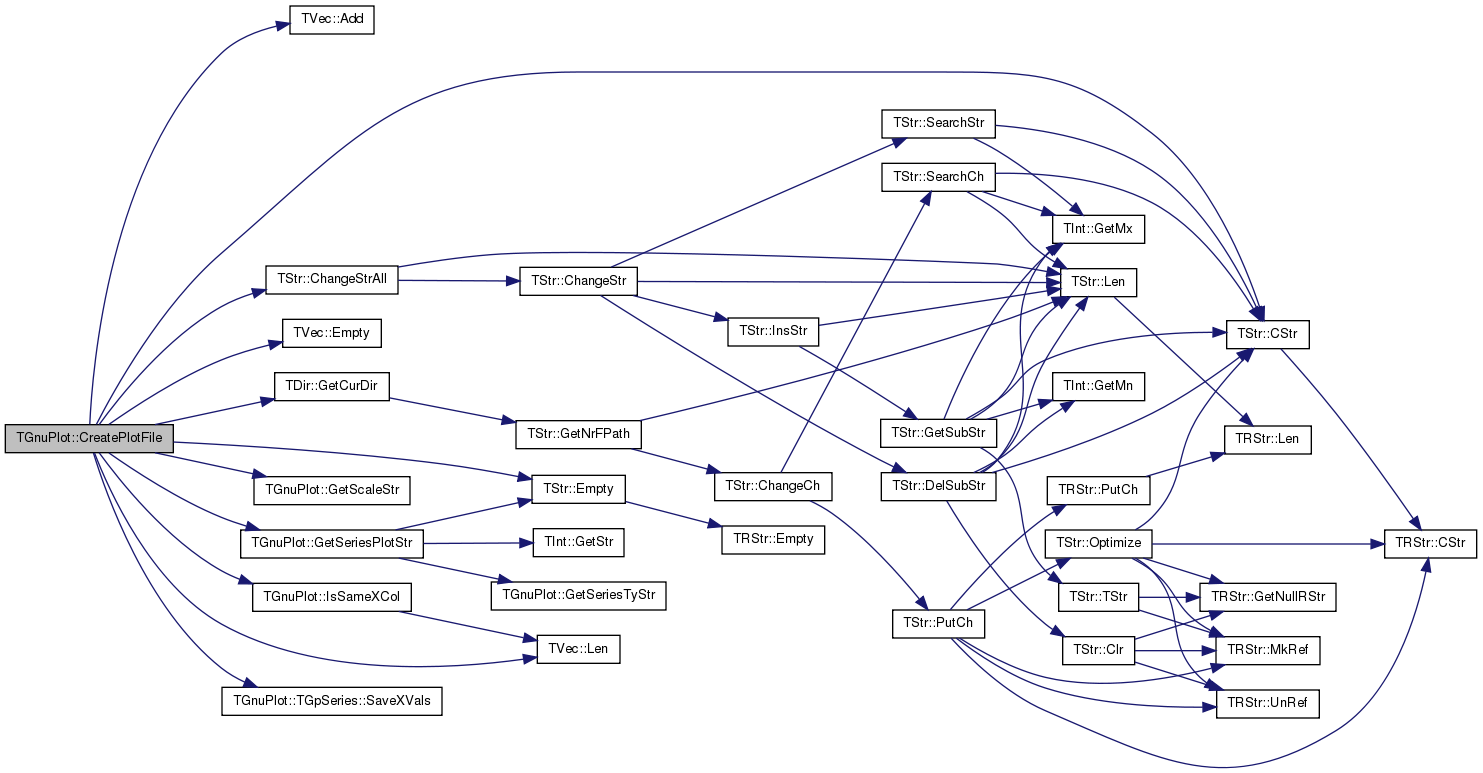
References TVec< TVal >::Add(), TStr::ChangeStrAll(), TStr::CStr(), TGnuPlot::TGpSeries::DataFNm, DataFNm, EAssertR, TVec< TVal >::Empty(), TStr::Empty(), TDir::GetCurDir(), GetScaleStr(), GetSeriesPlotStr(), gpsLog, gpsLog10X, gpsLog10XY, gpsLog10Y, gpsLog2X, gpsLog2XY, gpsLog2Y, IsSameXCol(), TGnuPlot::TGpSeries::Label, LblX, LblY, TVec< TVal >::Len(), MoreCmds, PlotFNm, TGnuPlot::TGpSeries::SaveXVals(), ScaleTy, SeriesV, SetGrid, SetPause, Tics42, Title, TPair< TVal1, TVal2 >::Val1, TPair< TVal1, TVal2 >::Val2, TGnuPlot::TGpSeries::XCol, XRange, TGnuPlot::TGpSeries::XYValV, TGnuPlot::TGpSeries::YCol, YRange, TGnuPlot::TGpSeries::ZCol, and TGnuPlot::TGpSeries::ZValV.
Referenced by Plot(), SaveEps(), and SavePng().
{
time_t ltime; time(<ime);
char* TimeStr = ctime(<ime); TimeStr[strlen(TimeStr) - 1] = 0;
// rearrange columns so that longest are on the left
//SeriesV.Sort(false);
TIntV SerIdV(SeriesV.Len(), 0);
for (int i = 0; i < SeriesV.Len(); i++) { SerIdV.Add(i); }
SerIdV.SortCmp(TGpSeriesCmp(SeriesV));
// set columns
int ColCnt = 1;
bool SaveData = false;
for (int s = 0; s < SeriesV.Len(); s++) {
TGpSeries& Plt = SeriesV[SerIdV[s]];
if (Plt.XYValV.Empty()) { continue; }
Plt.DataFNm = DataFNm;
// plots use same X column
const int PrevCol = s > 0 ? IsSameXCol(SerIdV[s], SerIdV[s-1]) : -1;
if (PrevCol != -1) { Plt.XCol = PrevCol; }
else { Plt.XCol = ColCnt; ColCnt++; }
Plt.YCol = ColCnt; ColCnt++;
if (! Plt.ZValV.Empty()) { Plt.ZCol = ColCnt; ColCnt++; }
if (! Plt.XYValV.Empty()) { SaveData=true; }
}
// save data file (skip duplicate X columns)
if (SaveData) {
FILE *F = fopen(DataFNm.CStr(), "wt");
EAssertR(F != NULL, TStr("Can not open data file ")+DataFNm);
fprintf(F, "#\n");
fprintf(F, "# %s (%s)\n", Comment.CStr(), TimeStr);
fprintf(F, "#\n");
// column names
for (int i = 0; i < SerIdV.Len(); i++) {
const TGpSeries& Ser = SeriesV[SerIdV[i]];
if (Ser.XYValV.Empty()) { continue; }
if (i == 0) { fprintf(F, "# "); } else { fprintf(F, "\t"); }
if (Ser.SaveXVals()) {
if (! LblX.Empty()) { fprintf(F, "%s\t", LblX.CStr()); }
else { fprintf(F, "XVals\t"); }
}
if (Ser.Label.Empty()) { fprintf(F, "%s", LblY.CStr()); }
else { fprintf(F, "%s", SeriesV[SerIdV[i]].Label.CStr()); }
if (Ser.ZCol > 0) fprintf(F, "\tDeltaY");
}
fprintf(F, "\n");
// data
for (int row = 0; row < SeriesV[SerIdV[0]].XYValV.Len(); row++) {
for (int i = 0; i < SeriesV.Len(); i++) {
const TGpSeries& Ser = SeriesV[SerIdV[i]];
if (row < Ser.XYValV.Len()) {
if (i > 0) { fprintf(F, "\t"); }
if (Ser.SaveXVals()) { fprintf(F, "%g\t%g", Ser.XYValV[row].Key(), Ser.XYValV[row].Dat()); }
else { fprintf(F, "%g", Ser.XYValV[row].Dat()); }
if (! Ser.ZValV.Empty()) { fprintf(F, "\t%g", Ser.ZValV[row]()); }
}
}
fprintf(F, "\n");
}
fclose(F);
}
// save plot file
FILE *F = fopen(PlotFNm.CStr(), "wt");
EAssertR(F != 0, TStr("Can not open plot file ")+PlotFNm);
TStr CurDir = TDir::GetCurDir();
CurDir.ChangeStrAll("\\", "\\\\");
fprintf(F, "#\n");
fprintf(F, "# %s (%s)\n", Comment.CStr(), TimeStr);
fprintf(F, "#\n\n");
if (! Title.Empty()) fprintf(F, "set title \"%s\"\n", Title.CStr());
fprintf(F, "set key bottom right\n");
fprintf(F, "%s\n", GetScaleStr(ScaleTy).CStr());
if (ScaleTy==gpsLog || ScaleTy==gpsLog10X || ScaleTy==gpsLog10XY) {
fprintf(F, "set format x \"10^{%%L}\"\n");
fprintf(F, "set mxtics 10\n"); }
if (ScaleTy==gpsLog || ScaleTy==gpsLog10Y || ScaleTy==gpsLog10XY) {
fprintf(F, "set format y \"10^{%%L}\"\n");
fprintf(F, "set mytics 10\n"); }
if (ScaleTy==gpsLog2X || ScaleTy==gpsLog2XY) { fprintf(F, "set format x \"2^{%%L}\"\n"); }
if (ScaleTy==gpsLog2Y || ScaleTy==gpsLog2XY) { fprintf(F, "set format y \"2^{%%L}\"\n"); }
if (SetGrid) fprintf(F, "set grid\n");
if (XRange.Val1 != XRange.Val2) fprintf(F, "set xrange [%g:%g]\n", XRange.Val1(), XRange.Val2());
if (YRange.Val1 != YRange.Val2) fprintf(F, "set yrange [%g:%g]\n", YRange.Val1(), YRange.Val2());
if (! LblX.Empty()) fprintf(F, "set xlabel \"%s\"\n", LblX.CStr());
if (! LblY.Empty()) fprintf(F, "set ylabel \"%s\"\n", LblY.CStr());
if (Tics42) {
fprintf(F, "set tics scale 2\n"); // New in version 4.2
} else {
fprintf(F, "set ticscale 2 1\n"); // Old (deprecated)
}
// custom commands
for (int i = 0; i < MoreCmds.Len(); i++) {
fprintf(F, "%s\n", MoreCmds[i].CStr()); }
// plot
if (! SeriesV.Empty()) {
fprintf(F, "plot \t");
for (int i = 0; i < SeriesV.Len(); i++) {
fprintf(F, "%s", GetSeriesPlotStr(i).CStr()); }
fprintf(F, "\n");
}
if (SetPause) fprintf(F, "pause -1 \"Hit return to exit. %s\"\n", PlotFNm.CStr());
fclose(F);
}
| TStr TGnuPlot::GetLineStyle | ( | const int & | PlotId | ) | const [inline] |
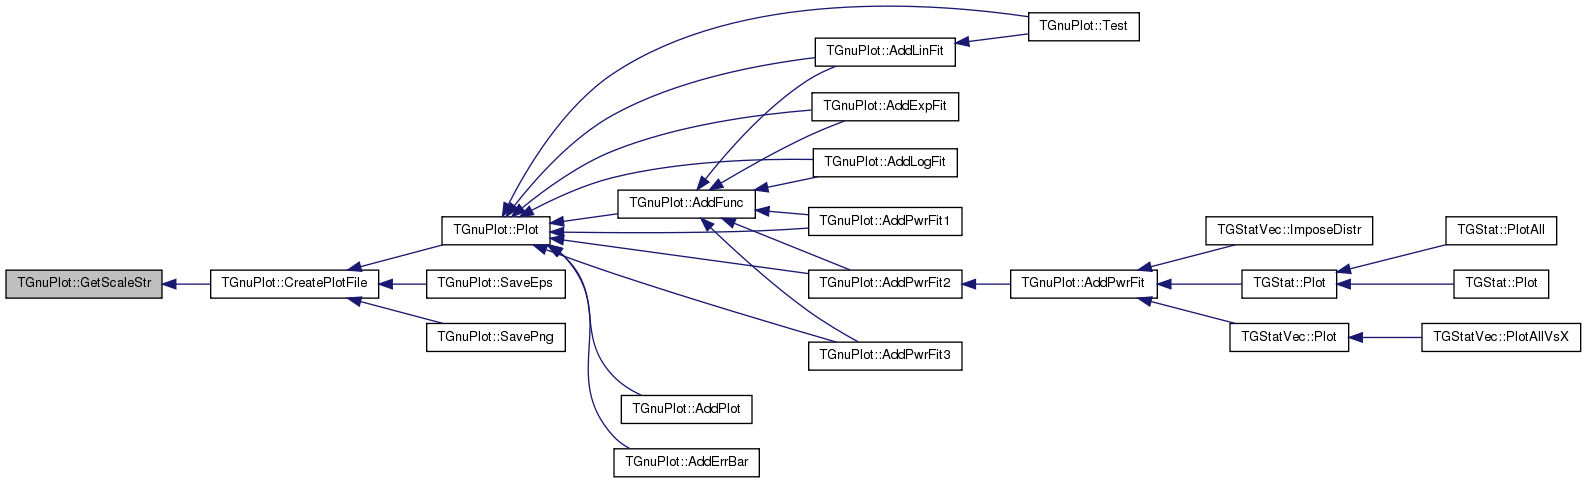
| TStr TGnuPlot::GetScaleStr | ( | const TGpScaleTy & | ScaleTy | ) | [static] |
Definition at line 677 of file gnuplot.cpp.
References Fail, gpsAuto, gpsLog, gpsLog10X, gpsLog10XY, gpsLog10Y, gpsLog2X, gpsLog2XY, gpsLog2Y, and gpsNoAuto.
Referenced by CreatePlotFile().
                                                    {
  switch(ScaleTy){
    case gpsNoAuto: return TStr("set noautoscale");
    case gpsAuto: return TStr("set autoscale");
    case gpsLog: return TStr("set logscale");
    case gpsLog2X: return TStr("set logscale x 2");
    case gpsLog2Y: return TStr("set logscale y 2");
    case gpsLog2XY: return TStr("set logscale xy 2");
    case gpsLog10X: return TStr("set logscale x 10");
    case gpsLog10Y: return TStr("set logscale y 10");
    case gpsLog10XY: return TStr("set logscale xy 10");
    default: Fail;
  }
  return TStr();
}
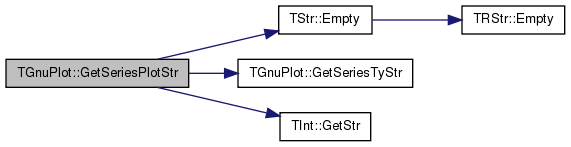
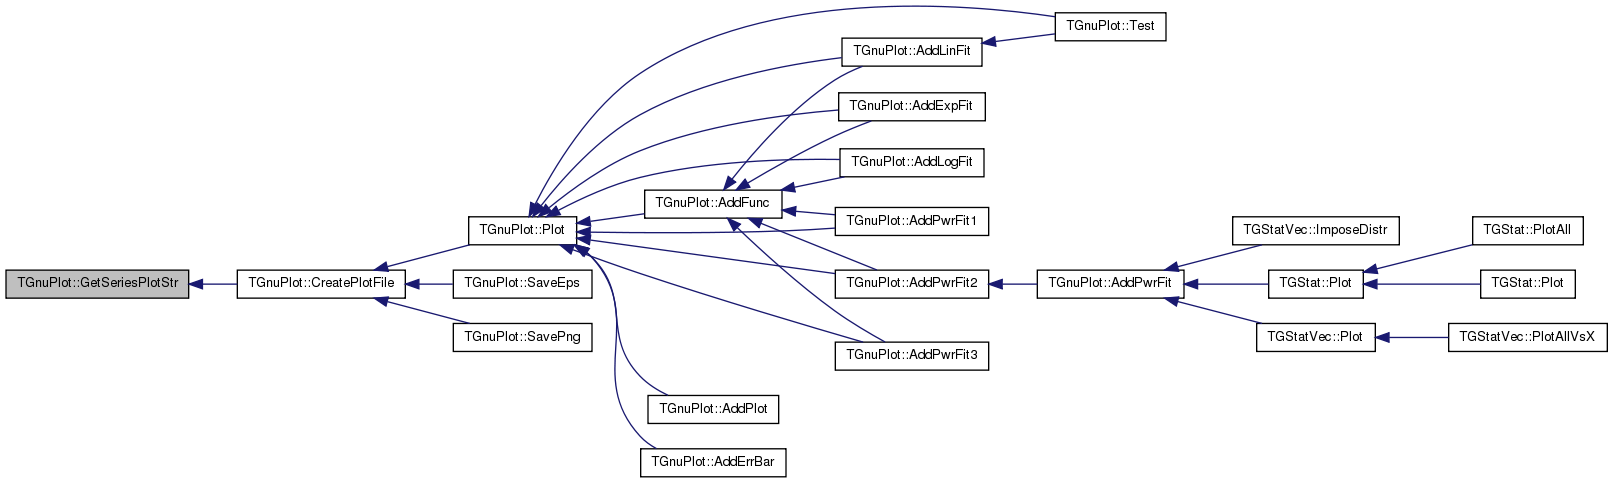
| TStr TGnuPlot::GetSeriesPlotStr | ( | const int & | PlotN | ) |
Definition at line 122 of file gnuplot.cpp.
References TGnuPlot::TGpSeries::DataFNm, TStr::Empty(), GetSeriesTyStr(), TInt::GetStr(), gpwBoxes, gpwFilledCurves, gpwLines, TGnuPlot::TGpSeries::Label, TGnuPlot::TGpSeries::SeriesTy, SeriesV, TGnuPlot::TGpSeries::WithStyle, TGnuPlot::TGpSeries::XCol, TGnuPlot::TGpSeries::YCol, and TGnuPlot::TGpSeries::ZCol.
Referenced by CreatePlotFile().
                                                   {
  TChA PlotStr;
  TGpSeries& Series = SeriesV[SeriesId];
  if (SeriesId != 0) PlotStr += ",\\\n\t";
  if (Series.XCol >= 0) {
    PlotStr += "\"" + Series.DataFNm + "\" using " + TInt::GetStr(Series.XCol);
    if (Series.YCol != 0) { PlotStr += ":" + TInt::GetStr(Series.YCol); }
    if (Series.ZCol != 0) { PlotStr += ":" + TInt::GetStr(Series.ZCol); }
    else if (Series.SeriesTy==gpwFilledCurves) { PlotStr += ":(0)"; } // filled curves requres 3rd column
  } else {
    // function
    //IAssertR(Series.DataFNm.SearchCh('=') != -1, TStr::Fmt("Expression %s is not a function", Series.DataFNm.CStr()));
    PlotStr += Series.DataFNm;
  }
  PlotStr += " title \"" + Series.Label + "\"";
  // hard coded line style
  if (Series.WithStyle.Empty()) {
    if (Series.SeriesTy == gpwLines) Series.WithStyle = "lw 1";
    //if (Series.SeriesTy == gpwPoints) Series.WithStyle = "pt 6 ps 1 lw 1"; // circles
    //if (Series.SeriesTy == gpwLinesPoints) Series.WithStyle = "pt 6 ps 1 lw 1"; // circles
    if (Series.SeriesTy == gpwBoxes) Series.WithStyle = "fill solid 0.3";
  }
  PlotStr += " with " + GetSeriesTyStr(Series.SeriesTy) + " " + Series.WithStyle;
  return PlotStr;
}
| TStr TGnuPlot::GetSeriesTyStr | ( | const TGpSeriesTy & | SeriesTy | ) | [static] |
Definition at line 693 of file gnuplot.cpp.
References Fail, gpwBoxes, gpwDots, gpwErrBars, gpwFilledCurves, gpwFSteps, gpwHiSteps, gpwImpulses, gpwLines, gpwLinesPoints, gpwPoints, and gpwSteps.
Referenced by GetSeriesPlotStr().
                                                         {
  switch(SeriesTy) {
    case gpwLines: return TStr("lines");
    case gpwPoints: return TStr("points");
    case gpwLinesPoints: return TStr("linespoints");
    case gpwImpulses: return TStr("impulses");
    case gpwDots: return TStr("dots");
    case gpwSteps: return TStr("steps");
    case gpwFSteps: return TStr("fsteps");
    case gpwHiSteps: return TStr("histeps");
    case gpwBoxes: return TStr("boxes");
    case gpwErrBars: return TStr("errorbars");
    case gpwFilledCurves: return TStr("filledcurves");
    default: Fail;
  }
  return TStr();
}
| int TGnuPlot::GetTics42 | ( | ) | [static, private] |
Definition at line 16 of file gnuplot.cpp.
                        {
#ifdef GLib_WIN
  return -1;
#else
  FILE* p;
  char Buf[1024];
  char Version[1024];
  size_t n;

  // get gnuplot version
  p = popen("gnuplot -V","r");
  if (p == NULL) {
    return -1;
  }
  n = fread(Buf, 1, 100, p);
  if (n <= 0) {
    return -1;
  }
  Buf[n] = '\0';
  pclose(p);

  // printf("Buf %d .%s.\n", n, Buf);
  n = sscanf(Buf, "gnuplot %s", Version);
  if (n <= 0) {
    return -1;
  }
  // printf("Version %d .%s.\n", n, Version);
  if ((strlen(Version) < 3) || (Version[1] != '.')) {
    return -1;
  }

  // test version < 4.2
  if ((Version[0] < '4') || ((Version[0] == '4') && (Version[2] < '2'))) {
    // printf("TGnuPlot::GetTics42 0\n");
    return 0;
  }
  // printf("TGnuPlot::GetTics42 1\n");
  return 1;
#endif
}
| int TGnuPlot::IsSameXCol | ( | const int & | CurId, |
| const int & | PrevId | ||
| ) | const |
Definition at line 752 of file gnuplot.cpp.
References IAssert, TVec< TVal >::Len(), and SeriesV.
Referenced by CreatePlotFile().
                                                                  {
  //if (SerId < 1) { return -1; }
  if (SeriesV[CurId].XYValV.Len() != SeriesV[PrevId].XYValV.Len()) { return -1; }
  for (int x = 0; x < SeriesV[CurId].XYValV.Len(); x++) {
    if (SeriesV[CurId].XYValV[x] != SeriesV[PrevId].XYValV[x]) { return -1; }
  }
  IAssert(SeriesV[PrevId].XCol > 0);
  return SeriesV[PrevId].XCol;
}


| void TGnuPlot::LoadTs | ( | const TStr & | FNm, |
| TStrV & | ColNmV, | ||
| TVec< TFltKdV > & | ColV | ||
| ) | [static] |
Definition at line 659 of file gnuplot.cpp.
References TVec< TVal >::Add(), TVec< TVal >::Clr(), TPt< TRec >::Empty(), TVec< TVal >::Gen(), TVec< TVal >::Len(), TSs::LoadTxt(), and ssfTabSep.
                                                                         {
  PSs Ss = TSs::LoadTxt(ssfTabSep, FNm);
  int row = 0;
  ColNmV.Clr();
  while (Ss->At(0, row)[0] == '#') { row++; }
  for (int c = 1; c < Ss->GetXLen(row); c+=2) {
    ColNmV.Add(Ss->At(c, row));
  }
  row++;
  ColV.Gen(ColNmV.Len(), ColNmV.Len());
  for (; row < Ss->GetYLen(); row++) {
    for (int c = 0; c < Ss->GetXLen(row); c+=2) {
      if (Ss->At(c,row).Empty()) break;
      ColV[c/2].Add(TFltKd(Ss->At(c,row).GetFlt(), Ss->At(c+1,row).GetFlt()));
    }
  }
}
| void TGnuPlot::MakeExpBins | ( | const TFltPrV & | XYValV, |
| TFltPrV & | ExpXYValV, | ||
| const double & | BinFactor = 2, |
||
| const double & | MinYVal = 1 |
||
| ) | [static] |
Definition at line 608 of file gnuplot.cpp.
References TVec< TVal >::Add(), TVec< TVal >::Gen(), and TVec< TVal >::Len().
Referenced by AddPlot(), TGStatVec::ImposeDistr(), and PlotValCntH().
                                                                                                                    {
  TFltKdV KdV(XYValV.Len(), 0), OutV;
  for (int i = 0; i < XYValV.Len(); i++) {
    KdV.Add(TFltKd(XYValV[i].Val1, XYValV[i].Val2)); }
  KdV.Sort();
  TGnuPlot::MakeExpBins(KdV, OutV, BinFactor, MinYVal);
  ExpXYValV.Gen(OutV.Len(), 0);
  for (int i = 0; i < OutV.Len(); i++) {
    ExpXYValV.Add(TFltPr(OutV[i].Key, OutV[i].Dat)); }
}
| void TGnuPlot::MakeExpBins | ( | const TFltKdV & | XYValV, |
| TFltKdV & | ExpXYValV, | ||
| const double & | BinFactor = 2, |
||
| const double & | MinYVal = 1 |
||
| ) | [static] |
Definition at line 619 of file gnuplot.cpp.
References TVec< TVal >::Add(), TVec< TVal >::Clr(), TVec< TVal >::Empty(), TVec< TVal >::Gen(), IAssert, TVec< TVal >::IsSorted(), TKeyDat< TKey, TDat >::Key, TVec< TVal >::Last(), and TVec< TVal >::Len().
                                                                                                                    {
  if (XYValV.Empty()) { ExpXYValV.Clr(false); return; }
  IAssert(! XYValV.Empty());
  IAssert(XYValV.IsSorted());
  const TFlt MxX = XYValV.Last().Key;
  // find buckets
  TFltV BucketEndV; BucketEndV.Add(1);
  double PrevBPos = 1, BPos = 1;
  while (BPos <= MxX) {
    PrevBPos = (uint) floor(BPos);
    BPos *= BinFactor;
    if (floor(BPos) == PrevBPos) {
      BPos = PrevBPos + 1; }
    BucketEndV.Add(floor(BPos));
  }
  //printf("buckets:\n"); for (int i = 0; i < BucketEndV.Len(); i++) { printf("\t%g\n", BucketEndV[i]);}
  ExpXYValV.Gen(BucketEndV.Len(), 0);
  int CurB = 0;
  double AvgPos=0, Cnt=0, AvgVal=0;
  for (int v = 0; v < XYValV.Len(); v++) {
    if (XYValV[v].Key() == 0.0) { continue; }
    AvgPos += XYValV[v].Key ;//* XYValV[v].Dat;  // x
    AvgVal += XYValV[v].Dat;  // y
    Cnt++;
    if (v+1 == XYValV.Len() || XYValV[v+1].Key > BucketEndV[CurB]) {
      if (Cnt != 0) {
        //AvgPos /= AvgVal;
        //AvgVal /= (BucketEndV[CurB]-BucketEndV[CurB-1]);
        AvgPos /= (double) Cnt;
        AvgVal /= (double) Cnt;
        if (AvgVal < MinYVal) { AvgVal = MinYVal; }
        ExpXYValV.Add(TFltKd(AvgPos, AvgVal));
        //printf("b: %6.2f\t%6.2f\n", AvgPos, AvgVal);
        AvgPos = 0;  AvgVal = 0;  Cnt = 0;
      }
      CurB++;
    }
  }
}
Definition at line 104 of file gnuplot.cpp.
References DataFNm, LblX, LblY, MoreCmds, PlotFNm, ScaleTy, SeriesV, SetGrid, SetPause, Title, XRange, and YRange.
                                                       {
  if (this != &GnuPlot) {
    DataFNm = GnuPlot.DataFNm;
    PlotFNm = GnuPlot.PlotFNm;
    Title = GnuPlot.Title;
    LblX = GnuPlot.LblX;
    LblY = GnuPlot.LblY;
    ScaleTy = GnuPlot.ScaleTy;
    YRange = GnuPlot.YRange;
    XRange = GnuPlot.XRange;
    SetGrid = GnuPlot.SetGrid;
    SetPause = GnuPlot.SetPause;
    SeriesV = GnuPlot.SeriesV;
    MoreCmds = GnuPlot.MoreCmds;
  }
  return *this;
}
| void TGnuPlot::Pause | ( | const bool & | DoPause | ) | [inline] |
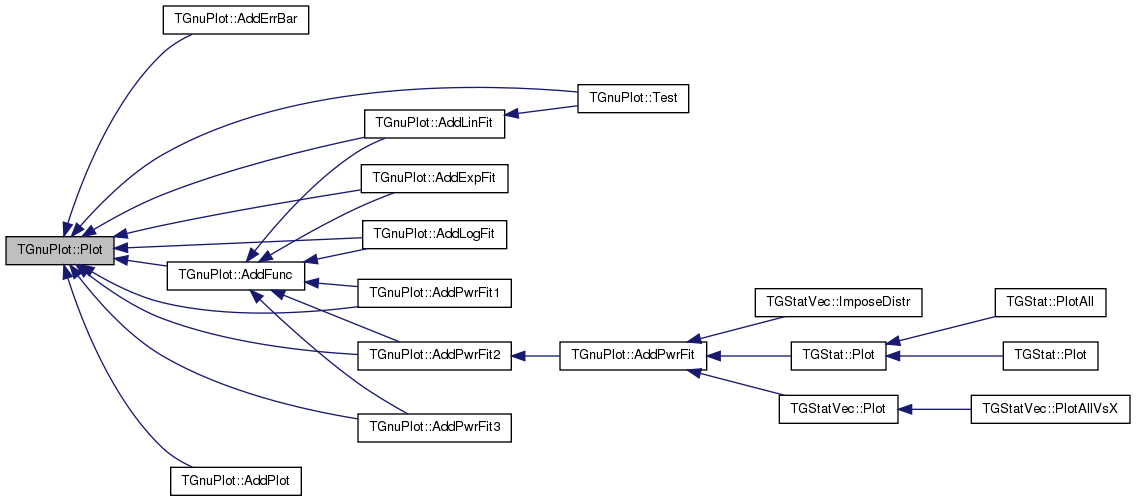
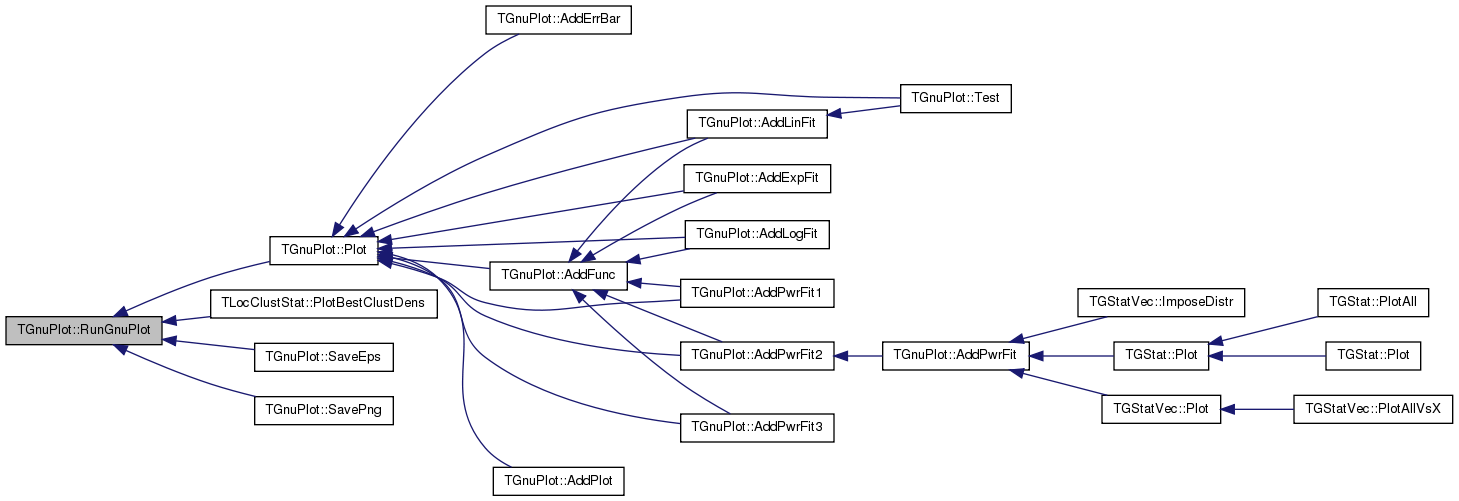
| void TGnuPlot::Plot | ( | const TStr & | Comment = TStr() | ) | [inline] |
Definition at line 120 of file gnuplot.h.
References CreatePlotFile(), and RunGnuPlot().
Referenced by AddErrBar(), AddExpFit(), AddFunc(), AddLinFit(), AddLogFit(), AddPlot(), AddPwrFit1(), AddPwrFit2(), AddPwrFit3(), and Test().
{ CreatePlotFile(Comment); RunGnuPlot(); }
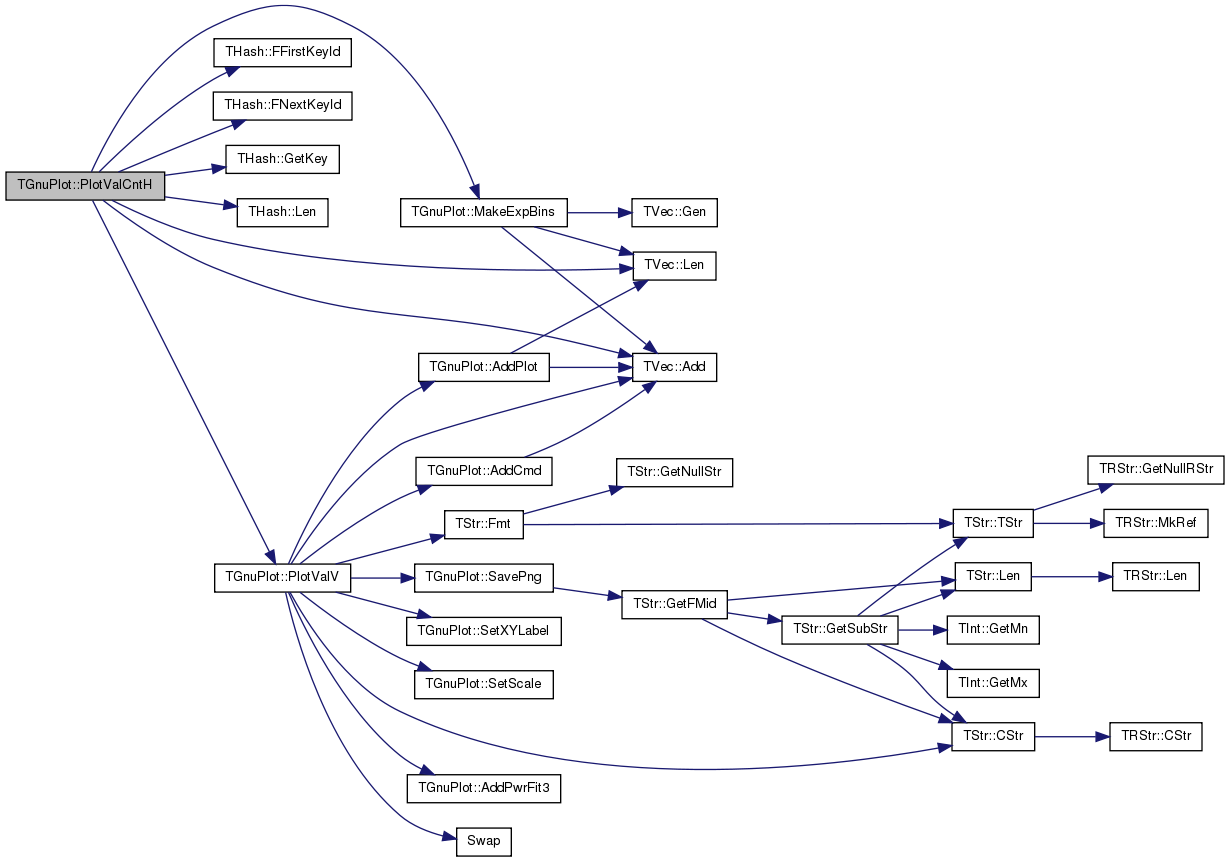
| void TGnuPlot::PlotValCntH | ( | const THash< TKey, TVal, THashFunc > & | ValCntH, |
| const TStr & | OutFNmPref, | ||
| const TStr & | Desc = "", |
||
| const TStr & | XLabel = "", |
||
| const TStr & | YLabel = "", |
||
| const TGpScaleTy & | ScaleTy = gpsAuto, |
||
| const bool & | PowerFit = false, |
||
| const TGpSeriesTy & | SeriesTy = gpwLinesPoints, |
||
| const bool & | PlotNCDF = false, |
||
| const bool & | ExpBucket = false |
||
| ) | [static] |
Definition at line 291 of file gnuplot.h.
References TVec< TVal >::Add(), THash< TKey, TDat, THashFunc >::FFirstKeyId(), THash< TKey, TDat, THashFunc >::FNextKeyId(), THash< TKey, TDat, THashFunc >::GetKey(), THash< TKey, TDat, THashFunc >::Len(), TVec< TVal >::Len(), MakeExpBins(), and PlotValV().
Referenced by TLocClust::DrawWhiskers(), TLocClustStat::PlotBoltzmanCurve(), TLocClustStat::PlotPhiDistr(), and PlotValCntH().
                                              {
  TFltPrV IdCntV(ValCntH.Len(), 0), BucketV;
  for (int i = ValCntH.FFirstKeyId(); ValCntH.FNextKeyId(i); ) {
    IdCntV.Add(TFltPr(double(ValCntH.GetKey(i)), double(ValCntH[i]))); }
  IdCntV.Sort();
  if (ExpBucket) {
    TGnuPlot::MakeExpBins(IdCntV, BucketV);
    BucketV.Swap(IdCntV);
  }
  if (PlotNCDF) {
    TFltPrV NCdfV = IdCntV;
    for (int i = NCdfV.Len()-2; i >= 0; i--) {
      NCdfV[i].Val2 = NCdfV[i].Val2 + NCdfV[i+1].Val2;
    }
    PlotValV(NCdfV, OutFNmPref, Desc, "NCDF "+XLabel, "NCDF "+YLabel, ScaleTy, PowerFit, SeriesTy);
  } else {
    PlotValV(IdCntV, OutFNmPref, Desc, XLabel, YLabel, ScaleTy, PowerFit, SeriesTy);
  }
}
| void TGnuPlot::PlotValCntH | ( | const THash< TKey, TVal, THashFunc > & | ValCntH1, |
| const TStr & | Label1, | ||
| const THash< TKey, TVal, THashFunc > & | ValCntH2, | ||
| const TStr & | Label2, | ||
| const TStr & | OutFNmPref, | ||
| const TStr & | Desc, | ||
| const TStr & | XLabel, | ||
| const TStr & | YLabel, | ||
| const TGpScaleTy & | ScaleTy = gpsAuto, |
||
| const TGpSeriesTy & | SeriesTy = gpwLinesPoints |
||
| ) | [static] |
Definition at line 314 of file gnuplot.h.
References PlotValCntH().
                                                                                   {
  PlotValCntH(ValCntH1, Label1, ValCntH2, Label2, THash<TKey, TVal, THashFunc>(), "", OutFNmPref, Desc, XLabel, YLabel,
    ScaleTy, SeriesTy);
}
| void TGnuPlot::PlotValCntH | ( | const THash< TKey, TVal, THashFunc > & | ValCntH1, |
| const TStr & | Label1, | ||
| const THash< TKey, TVal, THashFunc > & | ValCntH2, | ||
| const TStr & | Label2, | ||
| const THash< TKey, TVal, THashFunc > & | ValCntH3, | ||
| const TStr & | Label3, | ||
| const TStr & | OutFNmPref, | ||
| const TStr & | Desc, | ||
| const TStr & | XLabel, | ||
| const TStr & | YLabel, | ||
| const TGpScaleTy & | ScaleTy = gpsAuto, |
||
| const TGpSeriesTy & | SeriesTy = gpwLinesPoints |
||
| ) | [static] |
Definition at line 323 of file gnuplot.h.
References TVec< TVal >::Add(), AddPlot(), THash< TKey, TDat, THashFunc >::FFirstKeyId(), THash< TKey, TDat, THashFunc >::FNextKeyId(), THash< TKey, TDat, THashFunc >::GetKey(), THash< TKey, TDat, THashFunc >::Len(), SavePng(), SetScale(), and SetXYLabel().
                                                                                   {
  TFltPrV IdCntV1(ValCntH1.Len(), 0), IdCntV2(ValCntH2.Len(), 0), IdCntV3(ValCntH3.Len(), 0);
  for (int i = ValCntH1.FFirstKeyId(); ValCntH1.FNextKeyId(i); ) {
    IdCntV1.Add(TFltPr(double(ValCntH1.GetKey(i)), double(ValCntH1[i]))); }
  for (int i = ValCntH2.FFirstKeyId(); ValCntH2.FNextKeyId(i); ) {
    IdCntV2.Add(TFltPr(double(ValCntH2.GetKey(i)), double(ValCntH2[i]))); }
  for (int i = ValCntH3.FFirstKeyId(); ValCntH3.FNextKeyId(i); ) {
    IdCntV3.Add(TFltPr(double(ValCntH3.GetKey(i)), double(ValCntH3[i]))); }
  IdCntV1.Sort();
  IdCntV2.Sort();
  IdCntV3.Sort();
  TGnuPlot GP(OutFNmPref, Desc);
  GP.SetXYLabel(XLabel, YLabel);
  GP.SetScale(ScaleTy);
  if (! IdCntV1.Empty()) { GP.AddPlot(IdCntV1, SeriesTy, Label1); }
  if (! IdCntV2.Empty()) { GP.AddPlot(IdCntV2, SeriesTy, Label2); }
  if (! IdCntV3.Empty()) { GP.AddPlot(IdCntV3, SeriesTy, Label3); }
  GP.SavePng();
}
| void TGnuPlot::PlotValMomH | ( | const THash< TVal1, TMom > & | ValMomH, |
| const TStr & | OutFNmPref, | ||
| const TStr & | Desc = "", |
||
| const TStr & | XLabel = "", |
||
| const TStr & | YLabel = "", |
||
| const TGpScaleTy & | ScaleTy = gpsAuto, |
||
| const TGpSeriesTy & | SeriesTy = gpwLinesPoints, |
||
| bool | PlotAvg = true, |
||
| bool | PlotMed = true, |
||
| bool | PlotMin = false, |
||
| bool | PlotMax = false, |
||
| bool | PlotSDev = false, |
||
| bool | PlotStdErr = true, |
||
| bool | PlotScatter = false |
||
| ) | [static] |
Definition at line 426 of file gnuplot.h.
References TVec< TVal >::Add(), AddErrBar(), THashSet< TKey, THashFunc >::AddKey(), AddPlot(), TMom::Def(), TVec< TVal >::Empty(), THash< TKey, TDat, THashFunc >::FFirstKeyId(), THash< TKey, TDat, THashFunc >::FNextKeyId(), THash< TKey, TDat, THashFunc >::GetKey(), TMom::GetMean(), TMom::GetMedian(), TMom::GetMn(), TMom::GetMx(), TMom::GetSDev(), TMom::GetVals(), gpwPoints, TMom::IsDef(), THashSet< TKey, THashFunc >::Len(), SavePng(), SetScale(), SetXYLabel(), and TVec< TVal >::Sort().
Referenced by TNcpGraphsBase::PlotAvgNcp().
                                                                                                           {
  TFltTrV AvgV, StdErrV;
  TFltPrV AvgV2, MedV, MinV, MaxV;
  TFltPrV ScatterV;
  for (int i = ValMomH.FFirstKeyId(); ValMomH.FNextKeyId(i); ) {
    TMom Mom(ValMomH[i]);
    if (! Mom.IsDef()) { Mom.Def(); }
    const double x = ValMomH.GetKey(i);
    if (PlotAvg) {
      if (PlotSDev) {
        AvgV.Add(TFltTr(x, Mom.GetMean(), Mom.GetSDev())); } // std deviation
      else {
        AvgV2.Add(TFltPr(x, Mom.GetMean()));
      }
      if (PlotStdErr) {
        StdErrV.Add(TFltTr(x, Mom.GetMean(), Mom.GetSDev()/sqrt((double)Mom.GetVals())));
      }
    }
    if (PlotMed) { MedV.Add(TFltPr(x, Mom.GetMedian())); }
    if (PlotMin) { MinV.Add(TFltPr(x, Mom.GetMn())); }
    if (PlotMax) { MaxV.Add(TFltPr(x, Mom.GetMx())); }
    if (PlotScatter) {
      THashSet<TFlt> PointSet;
      for (int xi = 0; xi < ValMomH[i].GetVals(); xi++) {
        PointSet.AddKey(ValMomH[i].GetVal(xi)); }
        //ScatterV.Add(TFltPr(x, ValMomH[i].GetVal(xi)));  }
      for (int xi = 0; xi < PointSet.Len(); xi++) {
        ScatterV.Add(TFltPr(x, PointSet[xi]));  }
      //printf("S%d %d %d.", ValMomH[i].GetVals(), PointSet.Len(), ScatterV.Len());
    }
  }
  AvgV.Sort();  AvgV2.Sort();
  MedV.Sort();  MinV.Sort();  MaxV.Sort();  StdErrV.Sort();
  TGnuPlot GP(OutFNmPref, Desc);
  GP.SetScale(ScaleTy);
  GP.SetXYLabel(XLabel, YLabel);
  if (! ScatterV.Empty()) { GP.AddPlot(ScatterV, gpwPoints, "Scatter"); }
  if (! AvgV.Empty()) { GP.AddErrBar(AvgV, "Average", "StdDev"); }
  if (! AvgV2.Empty()) { GP.AddPlot(AvgV2, SeriesTy, "Average"); }
  if (! MedV.Empty()) { GP.AddPlot(MedV, SeriesTy, "Median"); }
  if (! MinV.Empty()) { GP.AddPlot(MinV, SeriesTy, "Min"); }
  if (! MaxV.Empty()) { GP.AddPlot(MaxV, SeriesTy, "Max"); }
  if (! StdErrV.Empty()) { GP.AddErrBar(StdErrV, "Standard error"); }
  GP.SavePng();
}

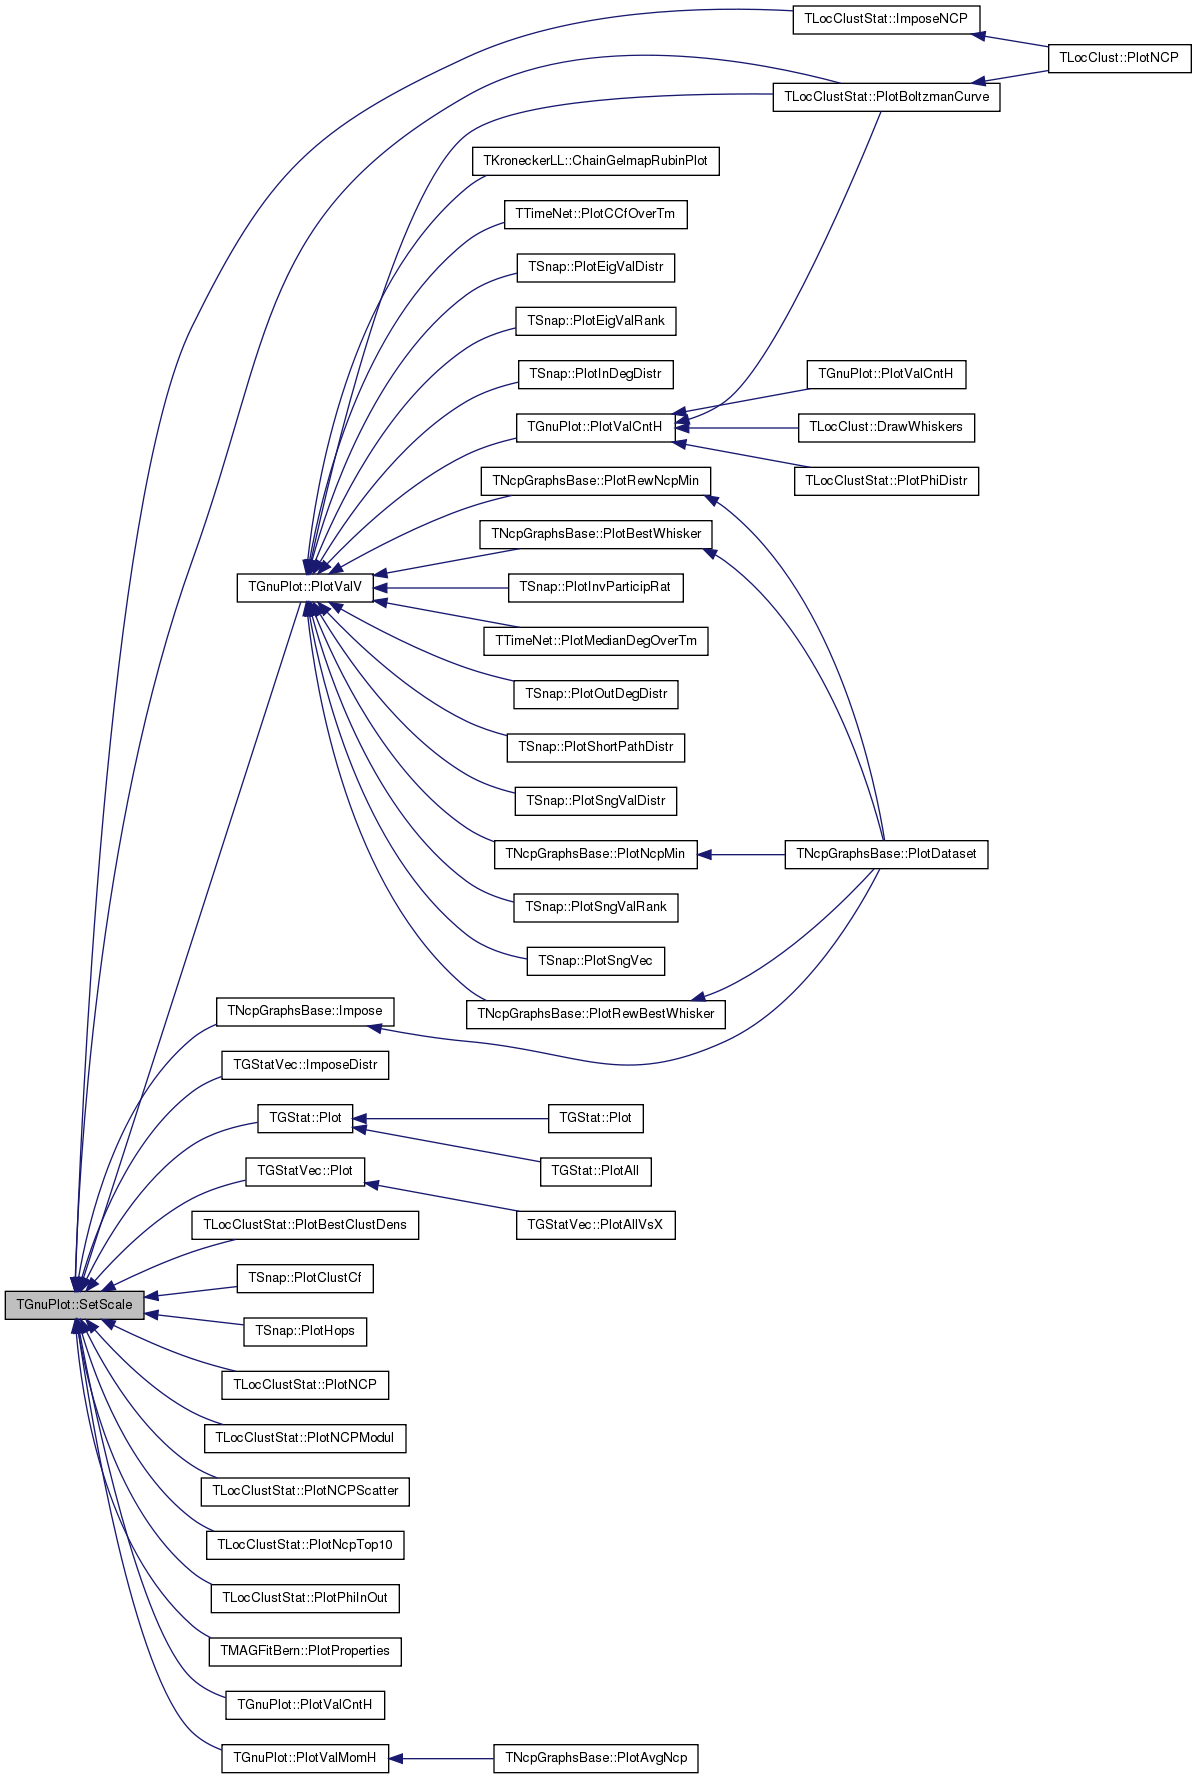
| void TGnuPlot::PlotValV | ( | const TVec< TPair< TVal1, TVal2 > > & | ValV, |
| const TStr & | OutFNmPref, | ||
| const TStr & | Desc = "", |
||
| const TStr & | XLabel = "", |
||
| const TStr & | YLabel = "", |
||
| const TGpScaleTy & | ScaleTy = gpsAuto, |
||
| const bool & | PowerFit = false, |
||
| const TGpSeriesTy & | SeriesTy = gpwLinesPoints |
||
| ) | [static] |
Definition at line 348 of file gnuplot.h.
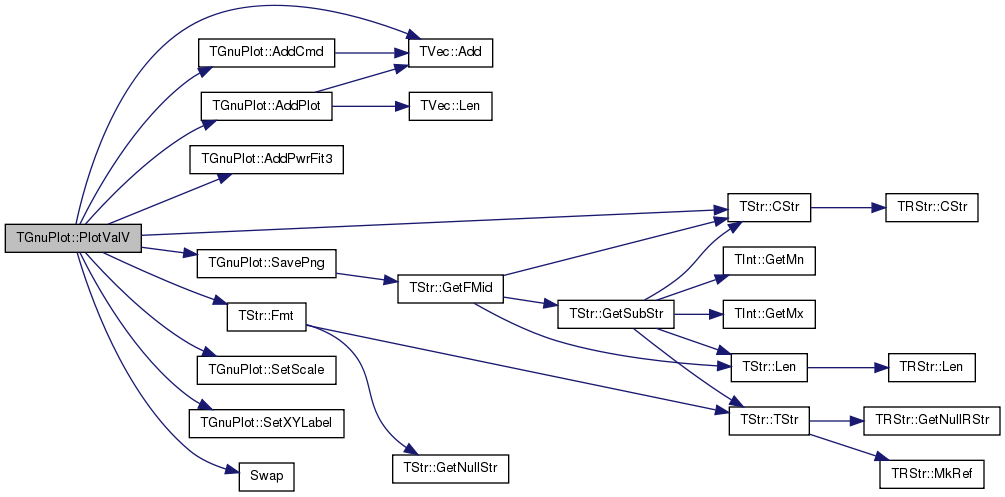
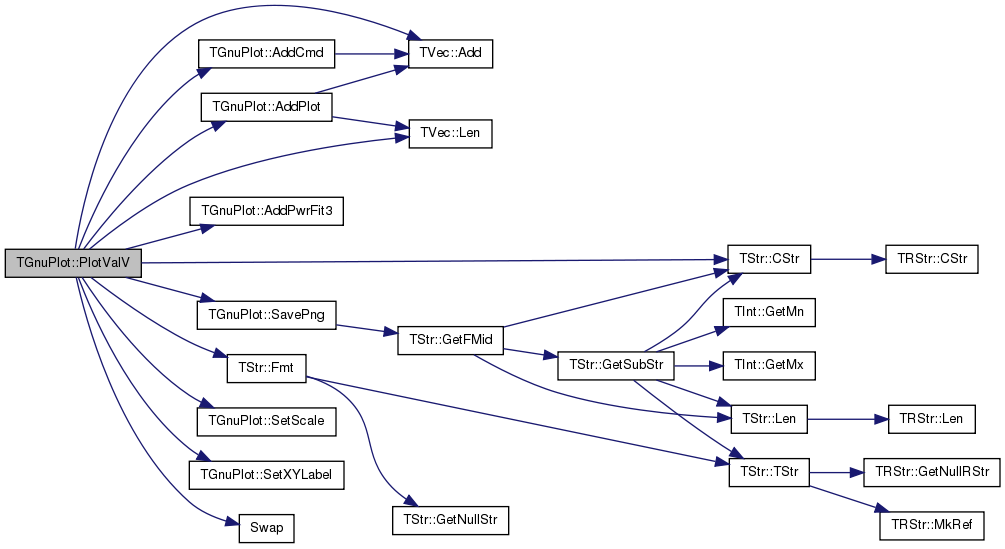
References TVec< TVal >::Add(), AddCmd(), AddPlot(), AddPwrFit3(), TStr::CStr(), TStr::Fmt(), SavePng(), SetScale(), SetXYLabel(), and Swap().
Referenced by TKroneckerLL::ChainGelmapRubinPlot(), TNcpGraphsBase::PlotBestWhisker(), TLocClustStat::PlotBoltzmanCurve(), TTimeNet::PlotCCfOverTm(), TSnap::PlotEigValDistr(), TSnap::PlotEigValRank(), TSnap::PlotInDegDistr(), TSnap::PlotInvParticipRat(), TTimeNet::PlotMedianDegOverTm(), TNcpGraphsBase::PlotNcpMin(), TSnap::PlotOutDegDistr(), TNcpGraphsBase::PlotRewBestWhisker(), TNcpGraphsBase::PlotRewNcpMin(), TSnap::PlotShortPathDistr(), TSnap::PlotSngValDistr(), TSnap::PlotSngValRank(), TSnap::PlotSngVec(), and PlotValCntH().
                                                                                                                       {
  TFltKdV IdCntV(ValV.Len(), 0);
  for (int i = 0; i < ValV.Len(); i++) {
    IdCntV.Add(TFltKd(double(ValV[i].Val1), double(ValV[i].Val2))); }
  if (IdCntV.Empty()) { printf("*** Empty plot %s\n", OutFNmPref.CStr());  return; }
  IdCntV.Sort();
  TGnuPlot GP(OutFNmPref, Desc);
  GP.SetXYLabel(XLabel, YLabel);
  GP.SetScale(ScaleTy);
  const int Id = GP.AddPlot(IdCntV, SeriesTy);
  if (PowerFit) {
    GP.AddPwrFit3(Id);
    double MaxY = IdCntV.Last().Dat, MinY = IdCntV[0].Dat;
    if (MaxY < MinY) { Swap(MaxY, MinY); }
    //GP.SetYRange(MinY, pow(10.0, floor(log10(MaxY))+1.0));
    GP.AddCmd(TStr::Fmt("set yrange[%f:]", MinY));
  }
  GP.SavePng();
}

| void TGnuPlot::PlotValV | ( | const TVec< TPair< TVal1, TVal2 > > & | ValV1, |
| const TStr & | Name1, | ||
| const TVec< TPair< TVal1, TVal2 > > & | ValV2, | ||
| const TStr & | Name2, | ||
| const TStr & | OutFNmPref, | ||
| const TStr & | Desc = "", |
||
| const TStr & | XLabel = "", |
||
| const TStr & | YLabel = "", |
||
| const TGpScaleTy & | ScaleTy = gpsAuto, |
||
| const bool & | PowerFit = false, |
||
| const TGpSeriesTy & | SeriesTy = gpwLinesPoints |
||
| ) | [static] |
Definition at line 370 of file gnuplot.h.
References TVec< TVal >::Add(), AddCmd(), AddPlot(), AddPwrFit3(), TStr::CStr(), TStr::Fmt(), SavePng(), SetScale(), SetXYLabel(), and Swap().
                                                                                                                       {
  TFltKdV IdCntV1(ValV1.Len(), 0), IdCntV2(ValV2.Len(), 0);
  for (int i = 0; i < ValV1.Len(); i++) {
    IdCntV1.Add(TFltKd(double(ValV1[i].Val1), double(ValV1[i].Val2))); }
  for (int i = 0; i < ValV2.Len(); i++) {
    IdCntV2.Add(TFltKd(double(ValV2[i].Val1), double(ValV2[i].Val2))); }
  if (IdCntV1.Empty() || IdCntV2.Empty()) { printf("*** Empty plot %s\n", OutFNmPref.CStr());  return; }
  IdCntV1.Sort();
  IdCntV2.Sort();
  TGnuPlot GP(OutFNmPref, Desc);
  GP.SetXYLabel(XLabel, YLabel);
  GP.SetScale(ScaleTy);
  { const int Id = GP.AddPlot(IdCntV1, SeriesTy, Name1);
  if (PowerFit) {
    GP.AddPwrFit3(Id);
    double MaxY = IdCntV1.Last().Dat, MinY = IdCntV1[0].Dat;
    if (MaxY < MinY) { Swap(MaxY, MinY); }
    GP.AddCmd(TStr::Fmt("set yrange[%f:]", MinY));
  } }
  { const int Id = GP.AddPlot(IdCntV2, SeriesTy, Name2);
  if (PowerFit) {
    GP.AddPwrFit3(Id);
    double MaxY = IdCntV2.Last().Dat, MinY = IdCntV2[0].Dat;
    if (MaxY < MinY) { Swap(MaxY, MinY); }
    GP.AddCmd(TStr::Fmt("set yrange[%f:]", MinY));
  } }
  GP.SavePng();
}
| void TGnuPlot::PlotValV | ( | const TVec< TVal1 > & | ValV, |
| const TStr & | OutFNmPref, | ||
| const TStr & | Desc = "", |
||
| const TStr & | XLabel = "", |
||
| const TStr & | YLabel = "", |
||
| const TGpScaleTy & | ScaleTy = gpsAuto, |
||
| const bool & | PowerFit = false, |
||
| const TGpSeriesTy & | SeriesTy = gpwLinesPoints |
||
| ) | [static] |
Definition at line 404 of file gnuplot.h.
References TVec< TVal >::Add(), AddCmd(), AddPlot(), AddPwrFit3(), TStr::CStr(), TStr::Fmt(), TVec< TVal >::Len(), SavePng(), SetScale(), SetXYLabel(), and Swap().
                                                                                                                       {
  TFltKdV IdCntV(ValV.Len(), 0);
  for (int i = 0; i < ValV.Len(); i++) {
    IdCntV.Add(TFltKd(double(i+1), double(ValV[i]))); }
  if (IdCntV.Empty()) { printf("*** Empty plot %s\n", OutFNmPref.CStr());  return; }
  IdCntV.Sort();
  TGnuPlot GP(OutFNmPref, Desc);
  GP.SetXYLabel(XLabel, YLabel);
  GP.SetScale(ScaleTy);
  const int Id = GP.AddPlot(IdCntV, SeriesTy);
  if (PowerFit) {
    GP.AddPwrFit3(Id);
    double MaxY = IdCntV.Last().Dat, MinY = IdCntV[0].Dat;
    if (MaxY < MinY) { Swap(MaxY, MinY); }
    //GP.SetYRange(MinY, pow(10.0, floor(log10(MaxY))+1.0));
    GP.AddCmd(TStr::Fmt("set yrange[%f:]", MinY));
  }
  GP.SavePng();
}
| void TGnuPlot::RunGnuPlot | ( | ) | const |
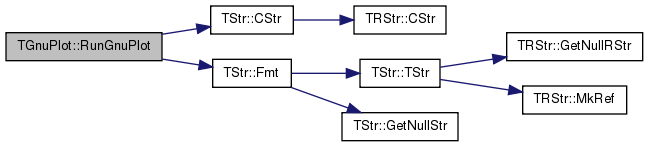
Definition at line 864 of file gnuplot.cpp.
References TStr::CStr(), TStr::Fmt(), and PlotFNm.
Referenced by Plot(), TLocClustStat::PlotBestClustDens(), SaveEps(), and SavePng().
                                {
  TStr GpFNm, GpPath;
  #if defined(GLib_WIN)
    GpFNm = "wgnuplot.exe";
    GpPath = "C:\\gnuplot\\";
  #elif defined(GLib_CYGWIN)
    GpFNm = "gnuplot.exe";
    GpPath = "/usr/bin/";
  #else
    GpFNm = "gnuplot";
    GpPath = "/usr/bin/";
  #endif
  if (system(TStr::Fmt("%s %s", GpFNm.CStr(), PlotFNm.CStr()).CStr())==0) { return; }
  #if defined(GLib_WIN)
  if (system(TStr::Fmt(".\\%s %s", GpFNm.CStr(), PlotFNm.CStr()).CStr())==0) { return; }
  #else
  if (system(TStr::Fmt("./%s %s", GpFNm.CStr(), PlotFNm.CStr()).CStr())==0) { return; }
  #endif
  if (system(TStr::Fmt("%s%s %s", GpPath.CStr(), GpFNm.CStr(), PlotFNm.CStr()).CStr())==0) { return; }
  //FailR(TStr::Fmt("Cat not find GnuPlot (%s) for plot %s. Set the PATH.", GpFNm.CStr(), PlotFNm.CStr()).CStr());
  //ErrNotify(TStr::Fmt("Cat not find GnuPlot (%s) for plot %s. Set the PATH.", GpFNm.CStr(), PlotFNm.CStr()).CStr());
  fprintf(stderr, "[%s:%d] Cat not find GnuPlot (%s) for plot %s. Set the PATH.\n", __FILE__, __LINE__, GpFNm.CStr(), PlotFNm.CStr());
}
| void TGnuPlot::SaveEps | ( | const int & | FontSz = 30, |
| const TStr & | Comment = TStr() |
||
| ) | [inline] |
Definition at line 117 of file gnuplot.h.
References TStr::GetFMid(), and PlotFNm.
Referenced by TMAGFitBern::PlotProperties().


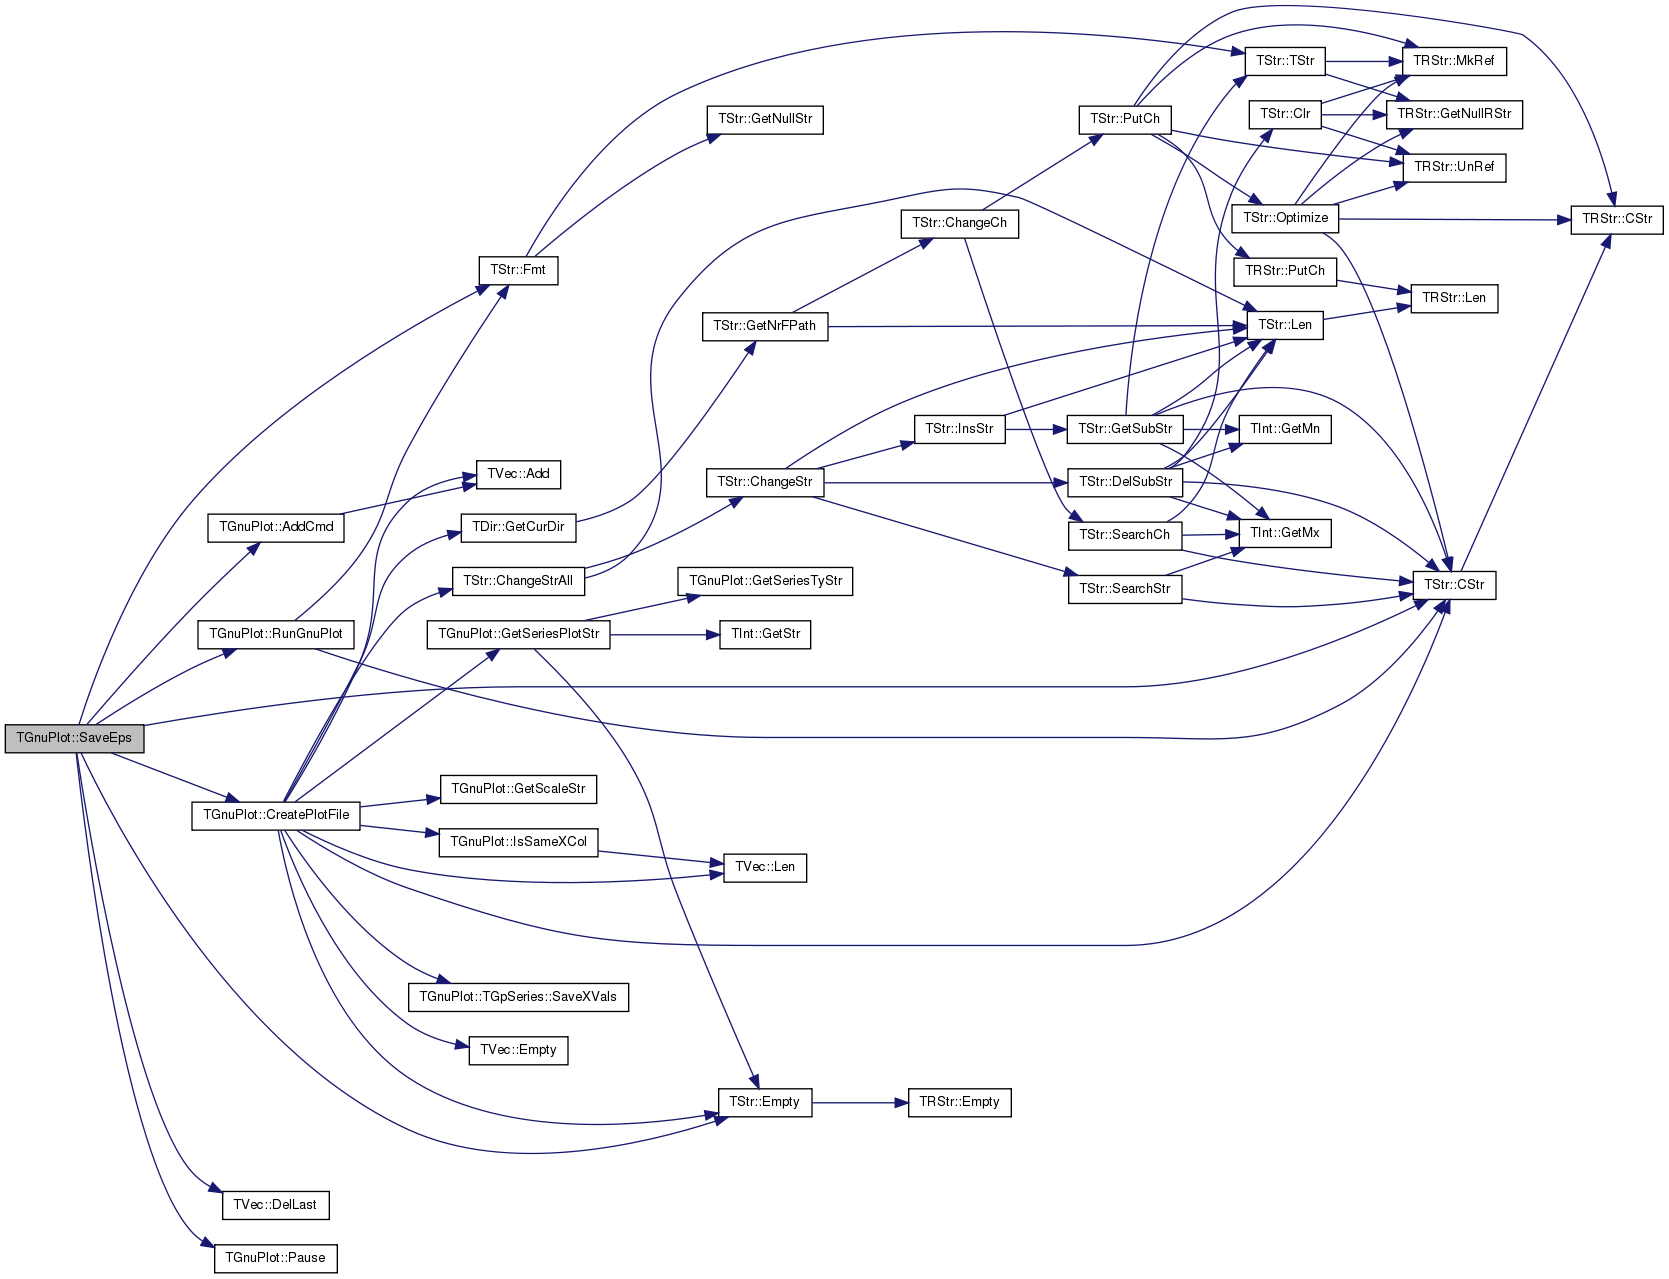
| void TGnuPlot::SaveEps | ( | const TStr & | FNm, |
| const int & | FontSz = 30, |
||
| const TStr & | Comment = TStr() |
||
| ) |
Definition at line 598 of file gnuplot.cpp.
References AddCmd(), CreatePlotFile(), TStr::CStr(), TVec< TVal >::DelLast(), TStr::Empty(), TStr::Fmt(), MoreCmds, Pause(), RunGnuPlot(), and Title.
                                                                              {
  AddCmd(TStr::Fmt("set terminal postscript enhanced eps %d color", FontSz));
  AddCmd(TStr::Fmt("set output '%s'", FNm.CStr()));
  Pause(false);
  CreatePlotFile(Comment.Empty()? Title : Comment);
  RunGnuPlot();
  MoreCmds.DelLast();
  MoreCmds.DelLast();
}
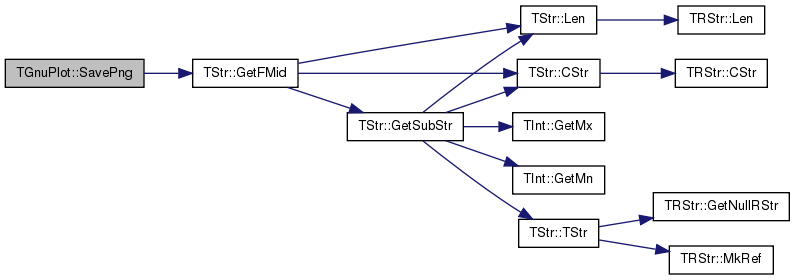
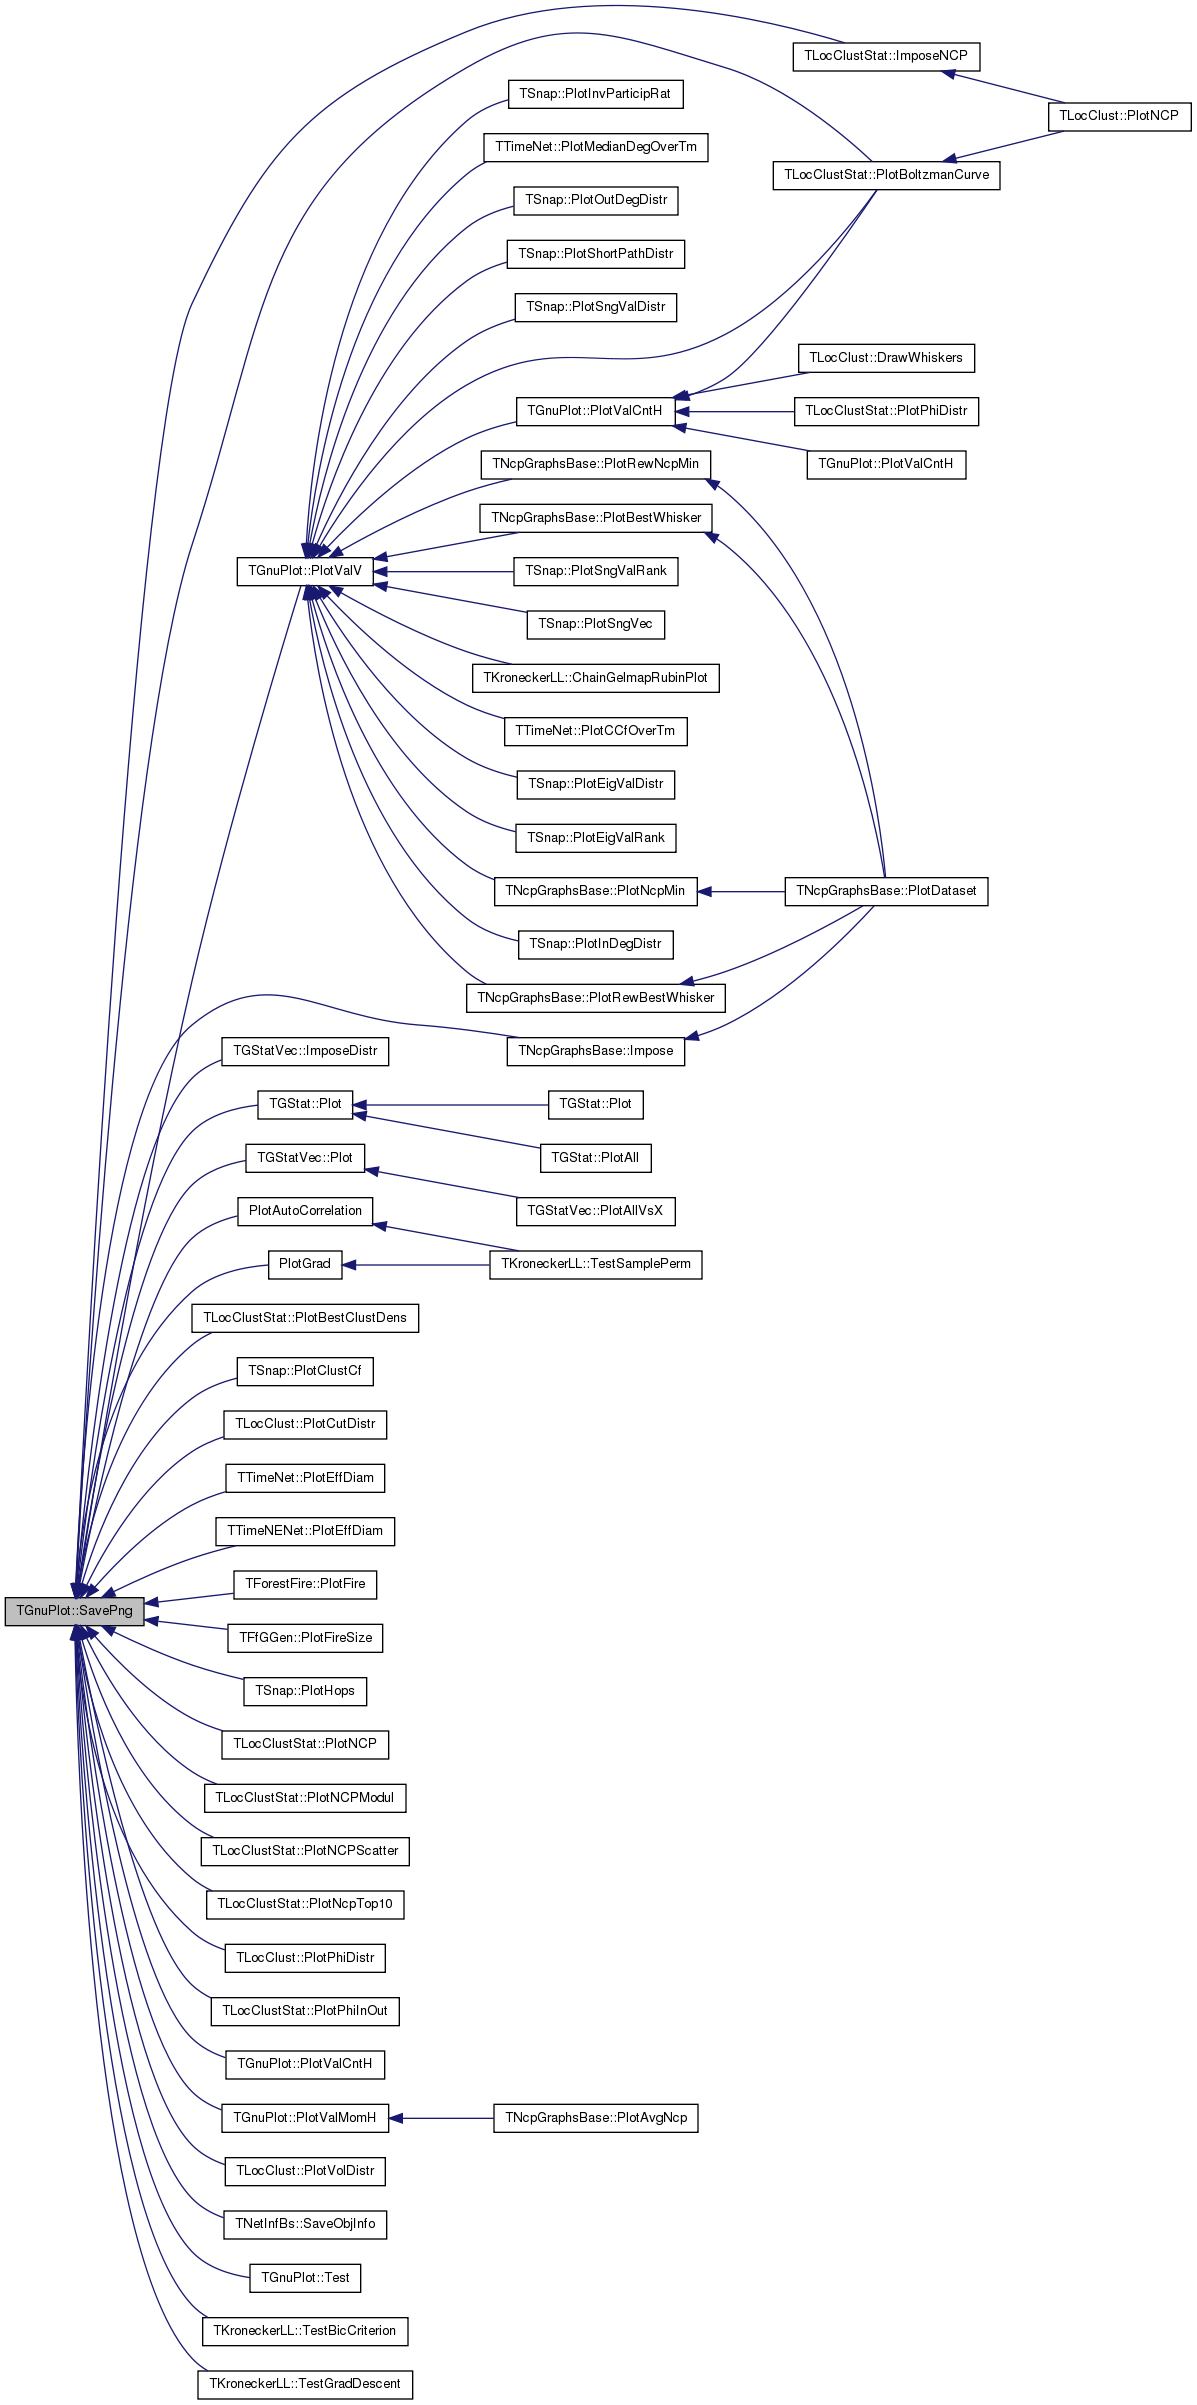
| void TGnuPlot::SavePng | ( | const int & | SizeX = 1000, |
| const int & | SizeY = 800, |
||
| const TStr & | Comment = TStr() |
||
| ) | [inline] |
Definition at line 114 of file gnuplot.h.
References TStr::GetFMid(), and PlotFNm.
Referenced by TNcpGraphsBase::Impose(), TGStatVec::ImposeDistr(), TLocClustStat::ImposeNCP(), TGStat::Plot(), TGStatVec::Plot(), PlotAutoCorrelation(), TLocClustStat::PlotBestClustDens(), TLocClustStat::PlotBoltzmanCurve(), TSnap::PlotClustCf(), TLocClust::PlotCutDistr(), TTimeNet::PlotEffDiam(), TTimeNENet::PlotEffDiam(), TForestFire::PlotFire(), TFfGGen::PlotFireSize(), PlotGrad(), TSnap::PlotHops(), TLocClustStat::PlotNCP(), TLocClustStat::PlotNCPModul(), TLocClustStat::PlotNCPScatter(), TLocClustStat::PlotNcpTop10(), TLocClust::PlotPhiDistr(), TLocClustStat::PlotPhiInOut(), PlotValCntH(), PlotValMomH(), PlotValV(), TLocClust::PlotVolDistr(), TNetInfBs::SaveObjInfo(), Test(), TKroneckerLL::TestBicCriterion(), and TKroneckerLL::TestGradDescent().
| void TGnuPlot::SavePng | ( | const TStr & | FNm, |
| const int & | SizeX = 1000, |
||
| const int & | SizeY = 800, |
||
| const TStr & | Comment = TStr(), |
||
| const TStr & | Terminal = TStr() |
||
| ) |
AddCmd("set terminal postscript eps 10 enhanced color"); AddCmd(TStr::Fmt("set output '%s.eps'", FNm.GetFMid().CStr()));
Definition at line 576 of file gnuplot.cpp.
References AddCmd(), CreatePlotFile(), TStr::CStr(), TVec< TVal >::DelLast(), TStr::Empty(), TStr::Fmt(), MoreCmds, Pause(), RunGnuPlot(), and Title.
                                                                                                                     {
  if (Terminal.Empty()) {
    //#ifdef GLib_WIN
    AddCmd(TStr::Fmt("set terminal png small size %d,%d", SizeX, SizeY));
    AddCmd(TStr::Fmt("set output '%s'", FNm.CStr()));
  } else {
    AddCmd(Terminal);
    AddCmd(TStr::Fmt("set output '%s'", FNm.CStr()));
  }
  Pause(false);
  CreatePlotFile(Comment.Empty()? Title : Comment);
  RunGnuPlot();
  MoreCmds.DelLast();
  MoreCmds.DelLast();
}

| void TGnuPlot::SaveTs | ( | const TIntKdV & | KdV, |
| const TStr & | FNm, | ||
| const TStr & | HeadLn = TStr() |
||
| ) | [static] |
Definition at line 711 of file gnuplot.cpp.
References TStr::CStr(), EAssert, TStr::Empty(), and TVec< TVal >::Len().
Referenced by TTimeNet::PlotCCfOverTm().
                                                                             {
  FILE *F = fopen(FNm.CStr(), "wt");
  EAssert(F);
  if (! HeadLn.Empty()) fprintf(F, "# %s\n", HeadLn.CStr());
  for (int i = 0; i < KdV.Len(); i++) {
    fprintf(F, "%d\t%d\n", KdV[i].Key(), KdV[i].Dat()); }
  fclose(F);
}

| static void TGnuPlot::SaveTs | ( | const TIntFltKdV & | KdV, |
| const TStr & | FNm, | ||
| const TStr & | HeadLn = TStr() |
||
| ) | [static] |
| void TGnuPlot::SaveTs | ( | const TVec< TPair< TVal1, TVal2 > > & | ValV, |
| const TStr & | FNm, | ||
| const TStr & | HeadLn = TStr() |
||
| ) | [static] |
Definition at line 201 of file gnuplot.h.
References TStr::CStr(), EAssert, and TStr::Empty().
                                                                                                 {
  FILE *F = fopen(FNm.CStr(), "wt");
  EAssert(F);
  if (! HeadLn.Empty()) { fprintf(F, "# %s\n", HeadLn.CStr()); }
  for (int i = 0; i < ValV.Len(); i++) {
    fprintf(F, "%g\t%g\n", double(ValV[i].Val1), double(ValV[i].Val2)); }
  fclose(F);
}

| void TGnuPlot::SaveTs | ( | const TVec< TTriple< TVal1, TVal2, TVal3 > > & | ValV, |
| const TStr & | FNm, | ||
| const TStr & | HeadLn = TStr() |
||
| ) | [static] |
Definition at line 211 of file gnuplot.h.
References TStr::CStr(), EAssert, and TStr::Empty().
                                                                                                          {
  FILE *F = fopen(FNm.CStr(), "wt");
  EAssert(F);
  if (! HeadLn.Empty()) { fprintf(F, "# %s\n", HeadLn.CStr()); }
  for (int i = 0; i < ValV.Len(); i++) {
    fprintf(F, "%g\t%g\t%g\n", double(ValV[i].Val1), double(ValV[i].Val2), double(ValV[i].Val3)); }
  fclose(F);
}

| void TGnuPlot::SaveTs | ( | const TVec< TTuple< TVal, Vals > > & | ValV, |
| const TStr & | FNm, | ||
| const TStr & | HeadLn = TStr() |
||
| ) | [static] |
Definition at line 221 of file gnuplot.h.
References TStr::CStr(), EAssert, and TStr::Empty().
                                                                                                {
  FILE *F = fopen(FNm.CStr(), "wt");
  EAssert(F);
  if (! HeadLn.Empty()) { fprintf(F, "# %s\n", HeadLn.CStr()); }
  for (int i = 0; i < ValV.Len(); i++) {
    fprintf(F, "%g", double(ValV[i][0]));
    for (int v = 1; v < Vals; v++) {
      fprintf(F, "\t%g", double(ValV[i][v])); }
    fprintf(F, "\n");
  }
  fclose(F);
}

| void TGnuPlot::SetDataPlotFNm | ( | const TStr & | DatFNm, |
| const TStr & | PltFNm | ||
| ) | [inline] |
| void TGnuPlot::SetLineStyle | ( | const int & | PlotId, |
| const TStr & | StyleStr | ||
| ) | [inline] |
| void TGnuPlot::SetScale | ( | const TGpScaleTy & | GpScaleTy | ) | [inline] |
Definition at line 72 of file gnuplot.h.
References ScaleTy.
Referenced by TNcpGraphsBase::Impose(), TGStatVec::ImposeDistr(), TLocClustStat::ImposeNCP(), TGStat::Plot(), TGStatVec::Plot(), TLocClustStat::PlotBestClustDens(), TLocClustStat::PlotBoltzmanCurve(), TSnap::PlotClustCf(), TSnap::PlotHops(), TLocClustStat::PlotNCP(), TLocClustStat::PlotNCPModul(), TLocClustStat::PlotNCPScatter(), TLocClustStat::PlotNcpTop10(), TLocClustStat::PlotPhiInOut(), TMAGFitBern::PlotProperties(), PlotValCntH(), PlotValMomH(), and PlotValV().
{ ScaleTy = GpScaleTy;}
| void TGnuPlot::SetTitle | ( | const TStr & | PlotTitle | ) | [inline] |
| void TGnuPlot::SetXLabel | ( | const TStr & | XLabel | ) | [inline] |
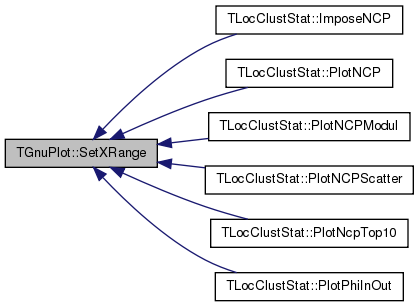
| void TGnuPlot::SetXRange | ( | const double & | Min, |
| const double & | Max | ||
| ) | [inline] |
Definition at line 73 of file gnuplot.h.
References XRange.
Referenced by TLocClustStat::ImposeNCP(), TLocClustStat::PlotNCP(), TLocClustStat::PlotNCPModul(), TLocClustStat::PlotNCPScatter(), TLocClustStat::PlotNcpTop10(), and TLocClustStat::PlotPhiInOut().
| void TGnuPlot::SetXYLabel | ( | const TStr & | XLabel, |
| const TStr & | YLabel | ||
| ) | [inline] |
Definition at line 67 of file gnuplot.h.
Referenced by TGStatVec::ImposeDistr(), TLocClustStat::ImposeNCP(), TGStat::Plot(), TGStatVec::Plot(), PlotAutoCorrelation(), TLocClustStat::PlotBestClustDens(), TLocClustStat::PlotBoltzmanCurve(), TSnap::PlotClustCf(), TLocClust::PlotCutDistr(), TTimeNet::PlotEffDiam(), TTimeNENet::PlotEffDiam(), TForestFire::PlotFire(), TFfGGen::PlotFireSize(), PlotGrad(), TSnap::PlotHops(), TLocClustStat::PlotNCP(), TLocClustStat::PlotNCPModul(), TLocClustStat::PlotNCPScatter(), TLocClustStat::PlotNcpTop10(), TLocClust::PlotPhiDistr(), TLocClustStat::PlotPhiInOut(), TMAGFitBern::PlotProperties(), PlotValCntH(), PlotValMomH(), PlotValV(), TLocClust::PlotVolDistr(), Test(), TKroneckerLL::TestBicCriterion(), and TKroneckerLL::TestGradDescent().
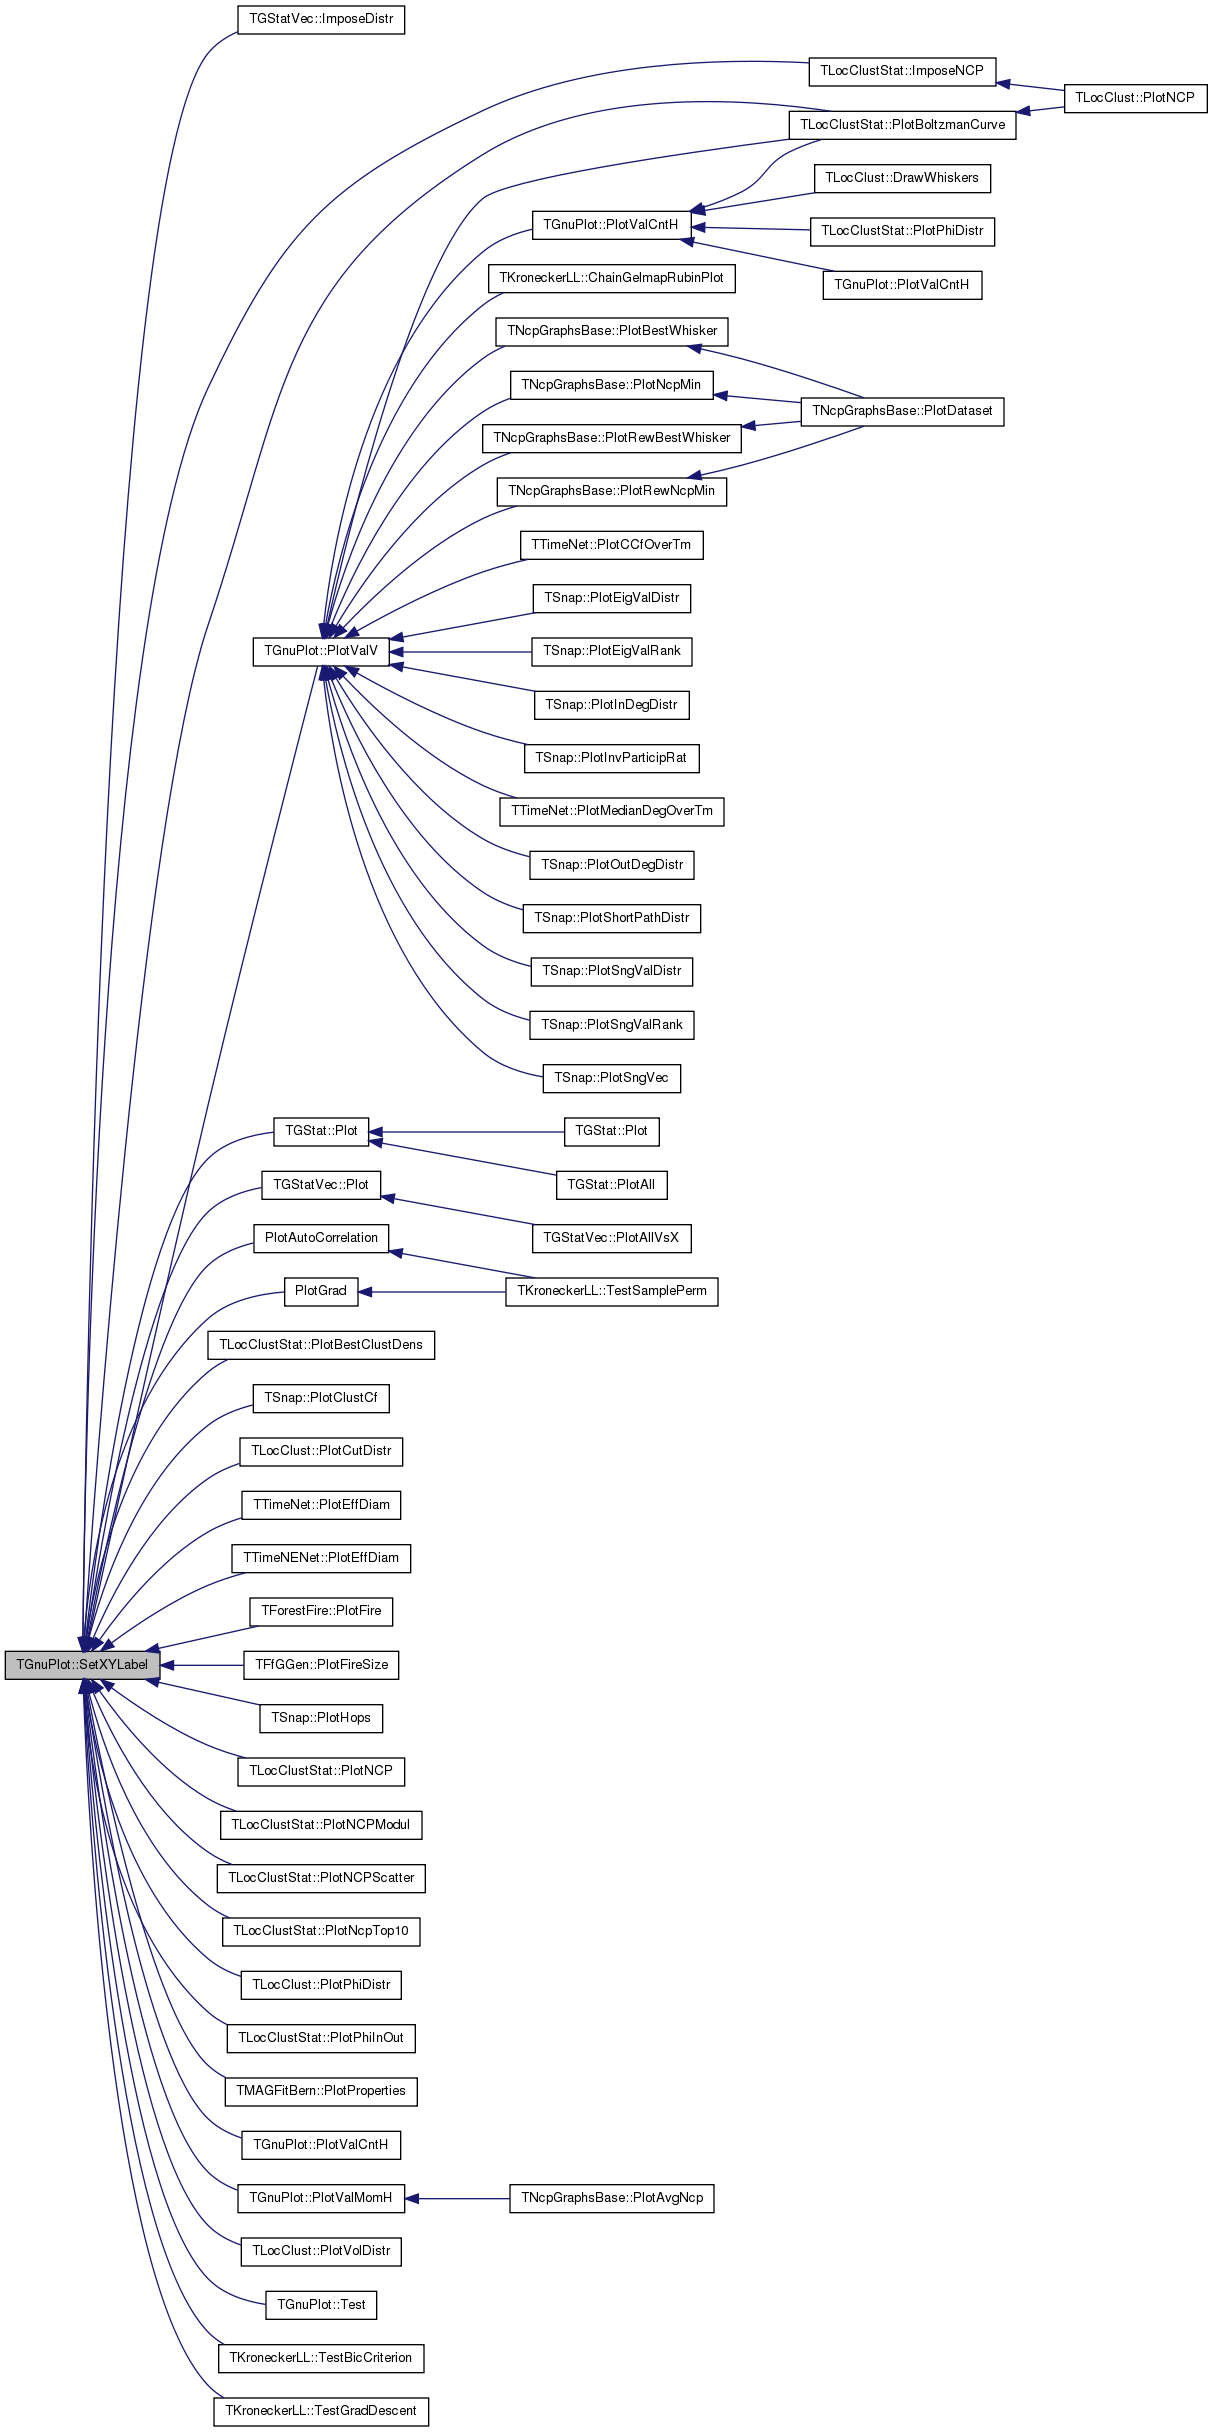
| void TGnuPlot::SetYLabel | ( | const TStr & | YLabel | ) | [inline] |
| void TGnuPlot::SetYRange | ( | const double & | Min, |
| const double & | Max | ||
| ) | [inline] |
| void TGnuPlot::ShowGrid | ( | const bool & | Show | ) | [inline] |
Definition at line 70 of file gnuplot.h.
References SetGrid.
Referenced by TMAGFitBern::PlotProperties().
{ SetGrid = Show; }

| void TGnuPlot::Test | ( | ) | [static] |
Definition at line 730 of file gnuplot.cpp.
References TVec< TVal >::Add(), AddErrBar(), AddLinFit(), AddPlot(), gpwLines, gpwPoints, Plot(), TInt::Rnd, SavePng(), and SetXYLabel().
                    {
  TFltV DeltaY;
  TFltPrV ValV1, ValV2, ValV3;
  for (int i = 1; i < 30; i++) {
    ValV1.Add(TFltPr(i, pow(double(i), 1.2)));
    DeltaY.Add(5*TInt::Rnd.GetUniDev());
    ValV2.Add(TFltPr(i, 5*i-1));
  }
  for (int i = -10; i < 20; i++) {
    ValV3.Add(TFltPr(i, 2*i + 2 + TInt::Rnd.GetUniDev()));
  }
  TGnuPlot GnuPlot("testDat", "TestPlot", true);
  GnuPlot.SetXYLabel("X", "Y");
  const int id2 = GnuPlot.AddPlot(ValV2, gpwPoints, "y=5*x-1");
  const int id3 = GnuPlot.AddPlot(ValV3, gpwPoints, "y=2*x+2");
  GnuPlot.AddErrBar(ValV1, DeltaY, "y=x^2", "Error bar");
  GnuPlot.AddLinFit(id2, gpwLines);
  GnuPlot.AddLinFit(id3, gpwLines);
  GnuPlot.Plot();
  GnuPlot.SavePng("testPlot.png");
}
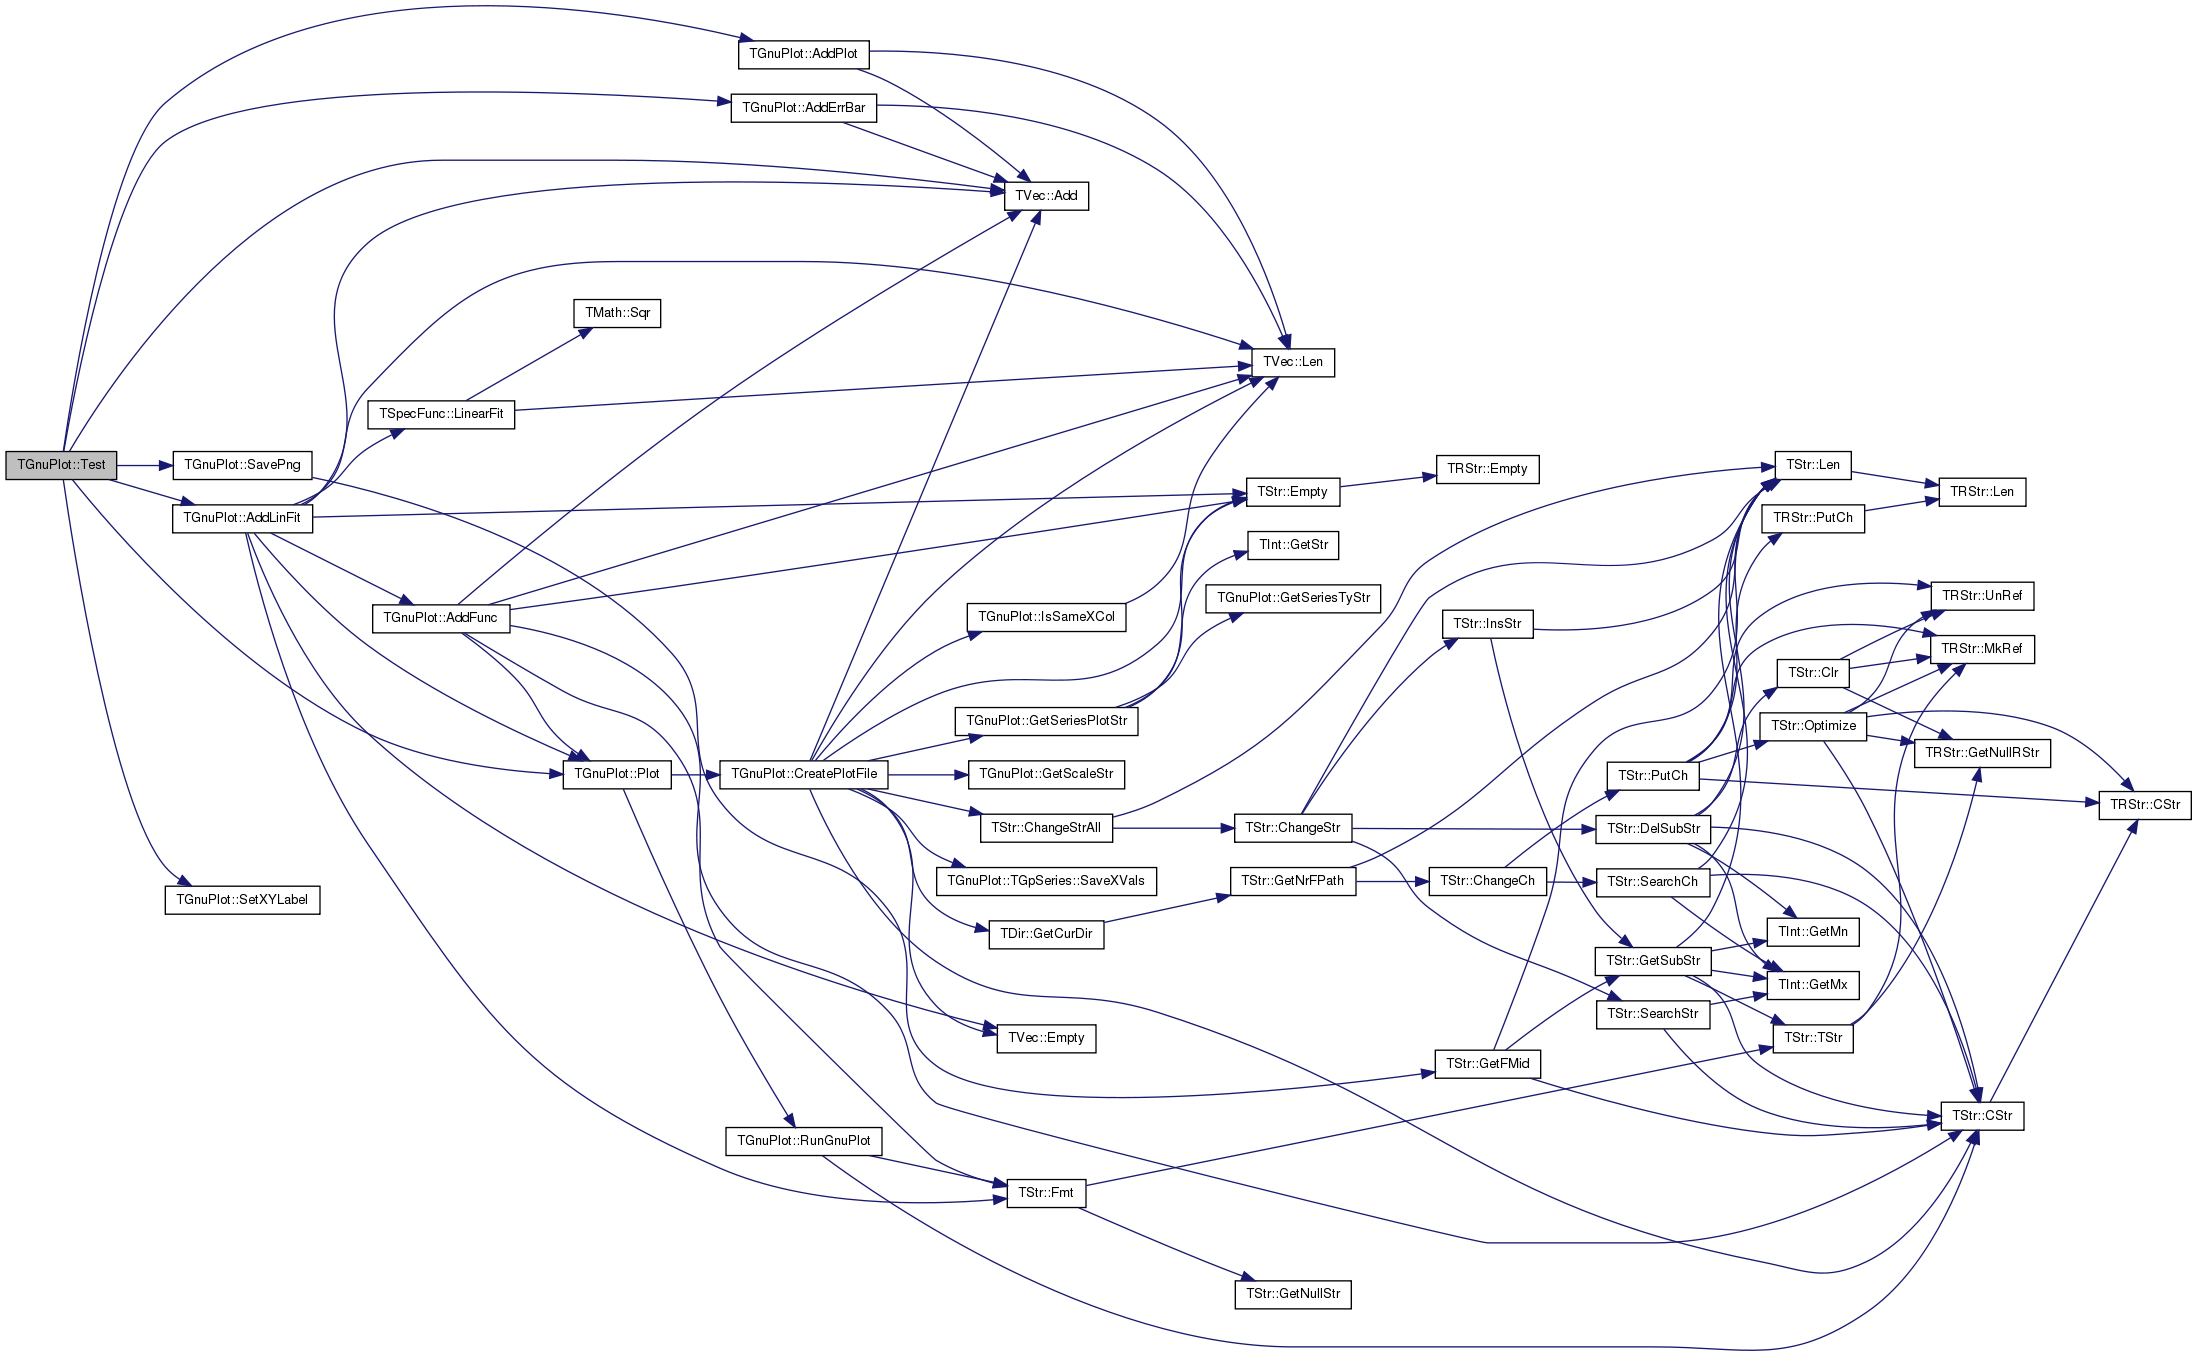
TStr TGnuPlot::DataFNm [private] |
Definition at line 45 of file gnuplot.h.
Referenced by AddErrBar(), AddPlot(), CreatePlotFile(), TGnuPlot::TGpSeries::operator=(), operator=(), and SetDataPlotFNm().
TStr TGnuPlot::DefDataFNm = "GnuPlot.tab" [static] |
TStr TGnuPlot::DefPlotFNm = "GnuPlot.plt" [static] |
TStr TGnuPlot::LblX [private] |
Definition at line 46 of file gnuplot.h.
Referenced by CreatePlotFile(), operator=(), SetXLabel(), and SetXYLabel().
TStr TGnuPlot::LblY [private] |
Definition at line 46 of file gnuplot.h.
Referenced by CreatePlotFile(), operator=(), SetXYLabel(), and SetYLabel().
TStrV TGnuPlot::MoreCmds [private] |
Definition at line 51 of file gnuplot.h.
Referenced by AddCmd(), CreatePlotFile(), operator=(), SaveEps(), and SavePng().
TStr TGnuPlot::PlotFNm [private] |
Definition at line 45 of file gnuplot.h.
Referenced by CreatePlotFile(), operator=(), RunGnuPlot(), SaveEps(), SavePng(), and SetDataPlotFNm().
TGpScaleTy TGnuPlot::ScaleTy [private] |
Definition at line 47 of file gnuplot.h.
Referenced by CreatePlotFile(), operator=(), and SetScale().
TVec<TGpSeries> TGnuPlot::SeriesV [private] |
Definition at line 50 of file gnuplot.h.
Referenced by AddErrBar(), AddExpFit(), AddFunc(), AddLinFit(), AddLogFit(), AddPlot(), AddPwrFit1(), AddPwrFit2(), AddPwrFit3(), CreatePlotFile(), GetLineStyle(), GetSeriesPlotStr(), IsSameXCol(), operator=(), and SetLineStyle().
bool TGnuPlot::SetGrid [private] |
Definition at line 49 of file gnuplot.h.
Referenced by CreatePlotFile(), operator=(), and ShowGrid().
bool TGnuPlot::SetPause [private] |
Definition at line 49 of file gnuplot.h.
Referenced by CreatePlotFile(), operator=(), and Pause().
int TGnuPlot::Tics42 = TGnuPlot::GetTics42() [static, private] |
Definition at line 44 of file gnuplot.h.
Referenced by CreatePlotFile().
TStr TGnuPlot::Title [private] |
Definition at line 46 of file gnuplot.h.
Referenced by AddErrBar(), AddPlot(), CreatePlotFile(), operator=(), SaveEps(), SavePng(), and SetTitle().
TFltPr TGnuPlot::XRange [private] |
Definition at line 48 of file gnuplot.h.
Referenced by CreatePlotFile(), operator=(), and SetXRange().
TFltPr TGnuPlot::YRange [private] |
Definition at line 48 of file gnuplot.h.
Referenced by CreatePlotFile(), operator=(), and SetYRange().
 1.8.0
1.8.0