


Most mentioned phrases during the 2008 U.S. presidential campaign. (Interactive Visualization)
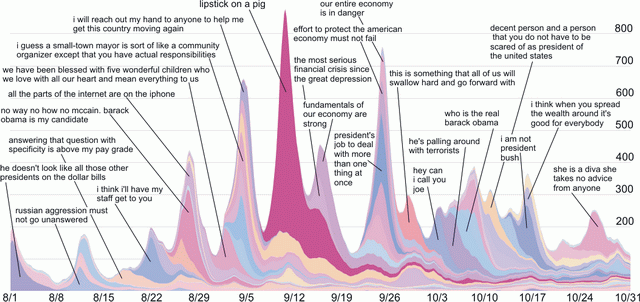
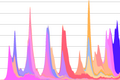
MemeTracker builds maps of the daily news cycle by analyzing around 900,000 news stories and blog posts per day from 1 million online sources, ranging from mass media to personal blogs.
We track the quotes and phrases that appear most frequently over time across this entire spectrum. This makes it possible to see how different stories compete for news and blog coverage each day, and how certain stories persist while others fade quickly.
The plot above shows the frequency of the top 50 quotes in the news and blogs over time, during the U.S. presidential election. For more read our paper:
J. Leskovec, L. Backstrom, J. Kleinberg. Meme-tracking and the Dynamics of the News Cycle. ACM SIGKDD Intl. Conf. on Knowledge Discovery and Data Mining, 2009.
New: With the Pew Project for Excellence in Journalism
we used the MemeTracker methodology to analyze of the
press coverage of the Great Depression.
See the report.
Additional results and visualizations
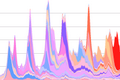 |
How quick are different media on reporting stories? |
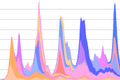 |
Top phrases between August 2008 and February 2009. |
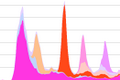 |
Phrases containing "economy". |
 |
Top phrases in the last month. |
See more graphs and plots.