Linear Influence Model (LIM)
LIM learns the global influence of a node on the rate of information diffusion.
Below, you can find some extra information:
About LIM
We assume the influence function of an individual node, the number of follow-up infections that the node's infection will bring. LIM models the rate of information diffusion as the sum of the influence function of individual nodes, and can be trained very efficiently with large data. For experiment, we track cascades of information diffusion on a set of 500 million Twitter posts and a set of 170 million news articles and blog posts, and then estimate the influence function of nodes using LIM
Paper (citation)
- J. Yang, J. Leskovec. Modeling Information Diffusion in Implicit Networks. IEEE International Conference On Data Mining (ICDM), 2010.
Plots
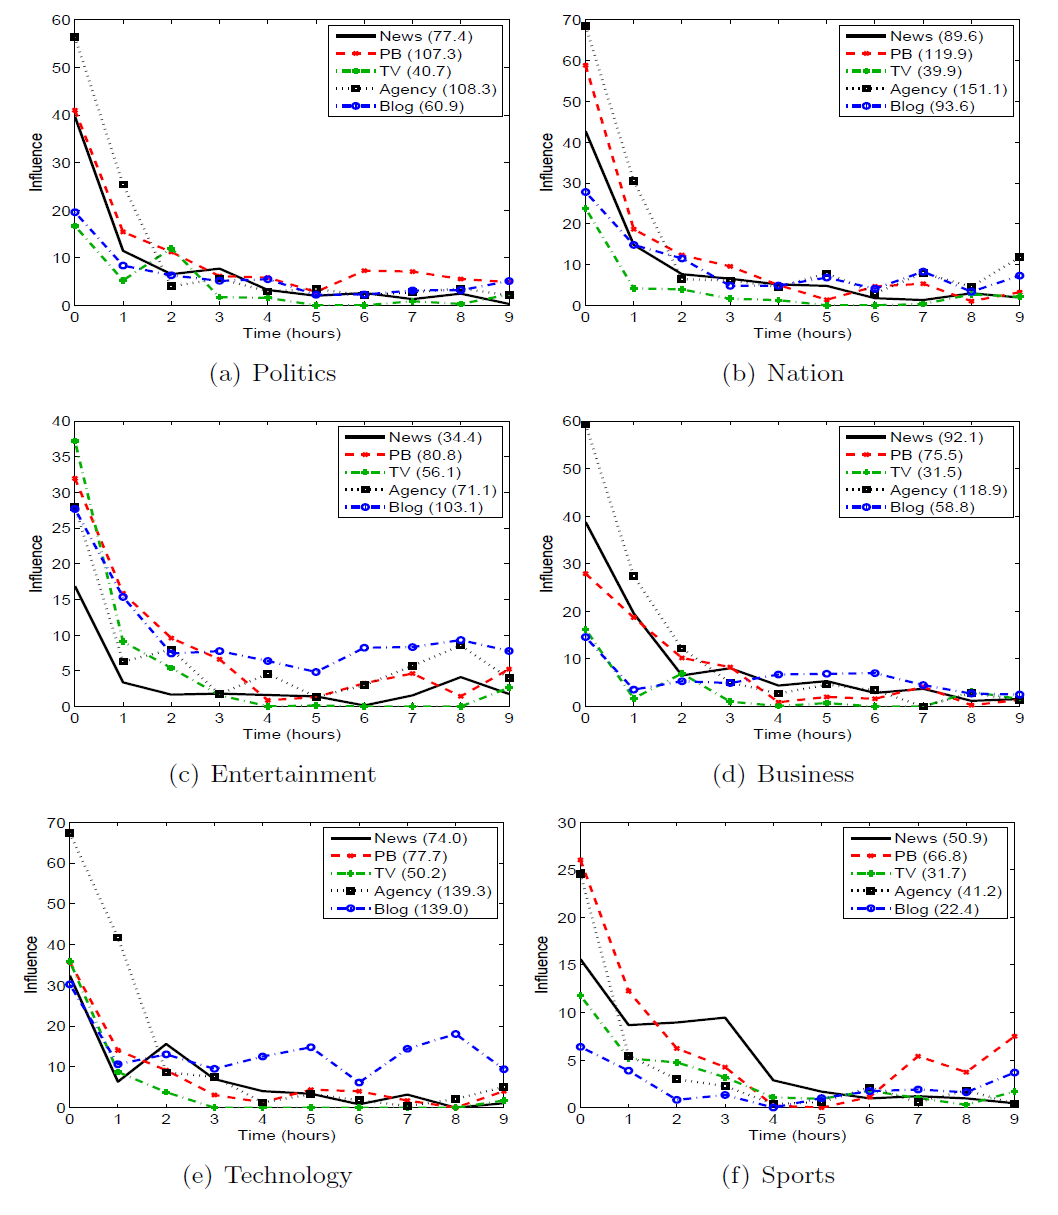
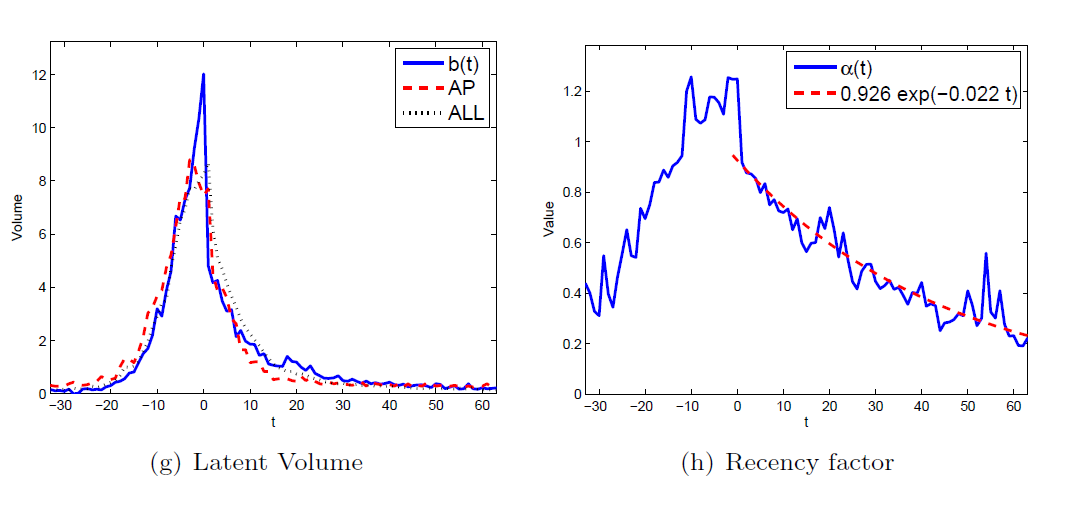
We examine the diffusion of short textual phrase over the online media space using the Memetracker data set.We show several plots about the influence of various type of media. Using the extension of LIM, we show the recency factor and the imitation factor that govern the adoption of phrase along with the influence of media.
You can click over the figures to see them bigger.
- Average influence function of various type of media on different topics (22 media grouped into 5 types and 1,000 cascades grouped into 6 topics):
- Recency factor and latent volume (caused by imitation factor)


Code & Data
We provide a simple MATLAB implementation of LIM and the Memetracker data that we used in our paper.
Input data file: The input file to LIM is a MATLAB binary data file(data_lim.mat). It contains a matrix data where each row vector correponds to a specific time index of a cascade. (If there are K cascades and each cascade has T time indices, then data has KT rows.) data has N+2 columns where N is the number of nodes that we model their influence functions. The first N columns denote how many times each of N nodes become infected to the cascade at the time index. The N+1-th column specifies the volume of the cascade at the time, and the last column (N+2-th) specifies which cascade the row corresponds to.
M_{u,k}(t) denotes how many times node u got infected to cascade k at time t. In the data set, we use K=1000 and N=100. The time length T of a cascade varies depending on how long the cascade lasted.
Also, the data file contains two auxilary vectors. The (K,1) cell phrname contains the phrase of K cascades. The (N,1) cell sitename contains the names of websites (nodes).
Running LIM: Script test_lim.m shows how to train LIM using the data file. Each row vector of the matrix Influence contains the influence function of each node. The script displays the average influence function of all the nodes. In addition, the script shows the comparison between the ground-truth volume of a test phrase and the predicted volume by LIM for the phrase. You can change which phrase to test inside the script.


